Dynamism of Graphic Elements
In the previous chapter, only ready standard symbols were used for the display and input of process information. In the following you will create dynamic displays yourself and in addition create own recyclable symbols.
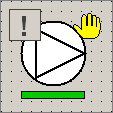
The first task will be to create the display of the pump P1. The result of this part of the task will look as follows:
 EXAMPLE
To create the first own device, proceed as follows:
-
Create a new panel and save it under the name myProcess.pnl.
-
Select the width (size X) 994 and the height (size Y) 514 pixels in the properties window of the panel
-
Specify the grid through the menu View > Grid/Snap settings with 8 x 8 pixels.
-
Draw a circle of 64 pixels and hold the [Shift] key (you can see the correct size 64x64 in the status bar down right).
-
Select white as fill color (background color) and black as border color (foreground color).
-
Specify the line width with 2 using the Border attribute.
-
Draw apolygon with 3 corners (equal-sided triangle with the pike to the right) above the circle and set the size in the Property Editor to 49x49 (51x51 pixels in the status bar). Select the fill color "Transparent" (radio box in the color selector) and the border color black. The line width should also be 2.
-
Hold the Ctrl key pressed and select the triangle and then the circle with the left mouse key. Place the triangle within the circle by a click on the
 button and then on the
 button from the
Layout Tools bar.
button from the
Layout Tools bar.
The fill color of the pump symbol should give information about the operating state of the pump - if the rotation speed of the pump is bigger than 0, the pump symbol shall be green, otherwise white. Configure this using the wizards.
-
Select the circle of the pump symbol.
-
In the properties sheet of the created circle (Ellipse1), select the standard tab.
-
Since the graphic property "background color" and the actual value of the rotation speed should be connected, this has to be specified already at the initialization.
-
Click on the wizard button of the "Initialize" event.
-
In the now opened wizards, activate the check box "Change color".
-
Select the entries "Background color " and "Value-dependent" in the next dialog and click on Next >.
-
Enter "P1.state.speed" for the data point element or select the corresponding entry through the data point selector
 .
. -
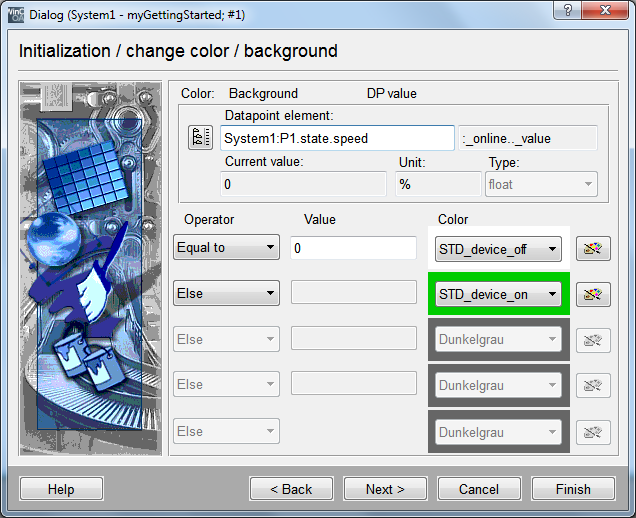
Select the relational operator "equal to" on the first row of the condition chain and the value 0 (or empty field) for the comparative value (the background color should visualize the OFF state only if the rotation speed is null).
-
Select the color name "STD_device_off" using the color selector (or another color for the OFF state).
-
On the second row of the condition chain, select the operator "otherwise".
-
Select the second color, for example, "STD_device_on" and click on Finish.
Additionally, the actual value of the rotation speed should be shown under the pump symbol using a horizontal bar. Furthermore, the current operating state "Manual mode" should be displayed through the visibility of a hand symbol.
-
Draw a rectangle (64x8 pixels) under the pump symbol.
-
Enter a bright background color for the rectangle, for example, white.
-
Copy this rectangle ([Strg]+[C] ð [Strg]+[V]) and place it directly above the first rectangle.
-
Enter a background color for the second rectangle, for example, "STD_device_on".
-
Select the upper (green) rectangle and click in the property sheet on the symbol "Open Property Wizard" next to the Initialize event to open the wizard.
-
Select "Scale Object" in the wizards.
-
For the scaling in x direction (horizontal) enter the data point element P1.state.speed of data point type GS_PUMP or select the element with the data point selector (hint: you can also use a filter for the data point selector in order to select the elements faster).
-
Select the "WinCC OA Value range" as basis for the scaling. This is meaningful since the range boundaries for this data point element were already set correctly (see figure in the chapter Functionality of the Device Oriented Data Object - Configs).
-
Click Finish.
The manual mode will be displayed by dynamic change of the visibility of an external created image file.
-
Draw a rectangle top right a pump symbol with approximately 32x32 pixels (see figure in the beginning of this page).
-
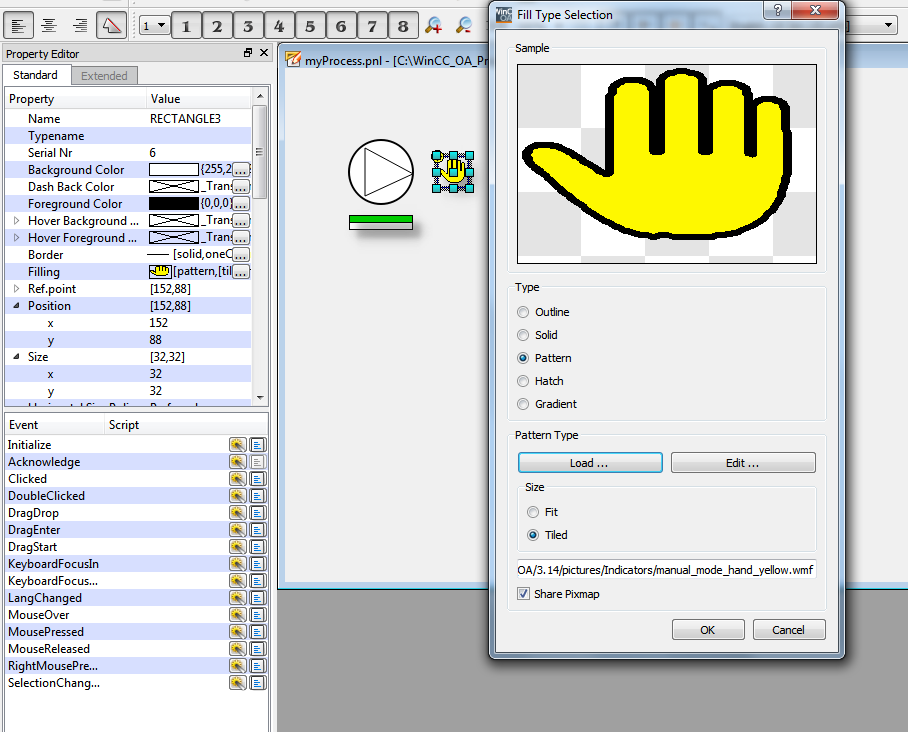
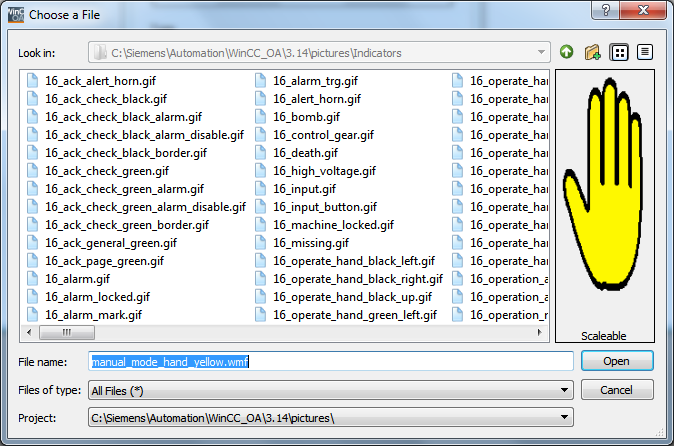
Select the option "Pattern" for the entry "Filling" in the property sheet of the rectangle and select the Installation directory in the file selection window using the combo box at the bottom of the window. If you have installed WinCC OA in the suggested directory, the selection will be C:/Siemens/Automation/WinCC_OA/<version>/pictures/.
-
Select all files (*.*) in the file selection dialog in the "File type" field.
-
Navigate to the file /Indicators/manual_mode_hand_yellow.wmf and click Open - the selected graphic will be added as rectangle.
-
Open the color selector for the foreground color (line color) by clicking next to the entry "Foreground color".
-
Activate in the color selector the radio box "transparent" on top left and confirm with OK - the border of the rectangle will be removed.
-
Select the rectangle with the yellowhand symbol.
-
Click on the "Open attribute wizards" button next to Initialize on the "Standard" tab of the property sheet in order to open the wizards for the simple configuration.
-
Activate the check mark for "Change Visibility".
-
Enter P1.state.manual for the data point.
-
Confirm the presetting (object visible when the value is TRUE) with complete.
You can now test the result of your configuration using the preview of the graphic editor. Since no elements for changing values were added to the panel, you have to change the values in PARA. A possibility for testing own graphic objects will be introduced in the next chapter (Dialogs for the Graphic Object: Test panel).
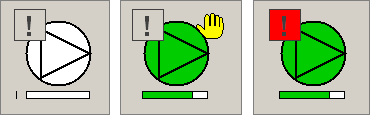
Furthermore, the alarm state should also be visualized. There are several ways to do this. One way is to use the display via a separate symbol above the pump symbol. As long as there is no alarm that should be acknowledged or that is pending, the new object will be displayed greyed out. In case of an active alarm, the graphic object will display the state color of the current alarm state.
-
Draw a frame of type "Text" in the pump symbol on top left (see figure at the beginning of this chapter) - this is the "A" symbol in the toolbar.
-
Select a darker shade of grey for the foreground color (text color) and a little bit brighter shade of grey for the background color .
-
Enter an exclamation mark "!" for the text and select the option Text format> Center in the property sheet.
-
Select the font "Arial", the font size14ptand the font style "Bold".
-
Click on the wizard button of Event "initialize" in order to open the wizard for the simple configuration.
-
Select the entry "Change color".
-
Activate the check box "Background color (filling, Text background)" in the dialog and make sure that the radio box "Alert handling" in the frame "Background" is selected. Click on Next.
-
Enter
P1.alarmfor the data point element and click on Finish.
The completed graphic for the pump P1 should look like shown in the first figure on this page. Confirm this by checking it in the graphic editor as well as in the preview.
The definition of dynamic properties for graphic objects using the wizard, is called "Simple Configuration" in WinCC OA. For more information see Simple Configuration, basics.
When you configure using the wizard, all configurations for defining the dynamic behavior of a graphic object, will be saved as a CONTROL script in the background. The wizard itself creates the scripts. If you click in the property sheet on the symbol "Open Script Editor (Symbol with code lines)" instead of "Open Property Wizard", the script editor will be opened. You can view and also edit the script. The script language provides a much bigger functional range as that of the wizards. For more information, see Scripting in the Graphic.


