Drawing the Infrastructure of the Example Process
The visualization of the small example plant is not only composed of devices. Also infrastructure objects like tanks or pipes must be mapped in order to make the device displays easy understandable for the user.
Therefore draw the environment of the pump P1 as shown in the following figure (after step 11). If you need instructions, execute the following steps - you can also try to draw on your own initiative. All necessary requirements were already described.
-
Open the process image
<proj_path>/panels/process.pnlfromthe current project directory. -
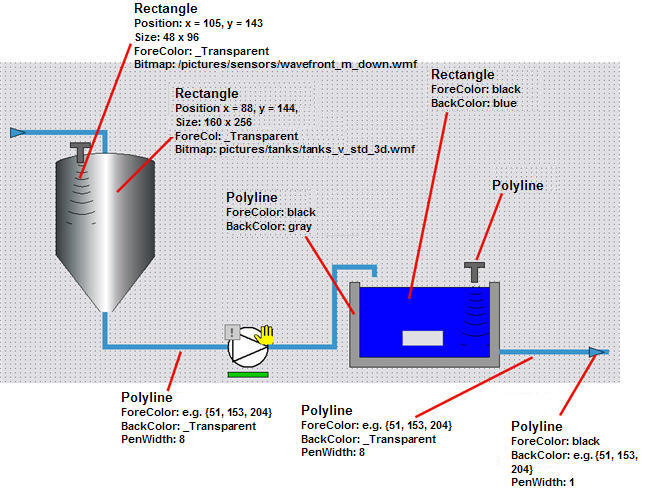
Draw a closed polyline using the polyline tool in order to stylize the concrete reservoir of the tank T2 down right of the image. Select dark gray or black for the foreground color (frame color) and a middle shade of gray for the background color (filling color).
-
Draw a rectangle in the stylized concrete reservoir that it fits exactly. Specify a blue background color for this filling (the fill level will be changed dynamically later).
-
Draw a rectangle with approximately 160x256 pixels to display the tank T1.
-
Select the entry Filling for the rectangle in the properties sheet and click on Pattern and thereafter on Load.... Select the
.../pictures/directory from the version directory as base directory. Specify the file type"All files(*.*). -
Select the file
<wincc_oa_path>/pictures/tanks/tanks_v_std_3d.wmf. After confirming the dialog with Open, the graphic will be applied to the rectangle. Select _Transparent for the foreground color in order to hide out the frame. -
Draw a small, T-shaped traverse in order to display an ultrasound sensor.
-
Draw directly beneath a rectangle with the size 48x96 pixels and select a graphic file as in the step 5
<wincc_oa_path>/pictures/sensors/wavefront_m_down.wmf. -
Select the ultrasound sensor and the stylized wave front and copy it ([Ctrl]+[C] > [Ctrl]+[V]). Position this second level measurement left in the tank T2 (the concrete reservoir).
-
Draw both pipes as polyline or line with the line width 8 and a blue foreground color. In order to get a line without surface, set the background color transparent for the polyline.
-
Draw the flow direction arrows for the pipe as traverse with 3 supporting points (triangle) - Select the shade of blue of the pipe for the background color and black for the foreground color.
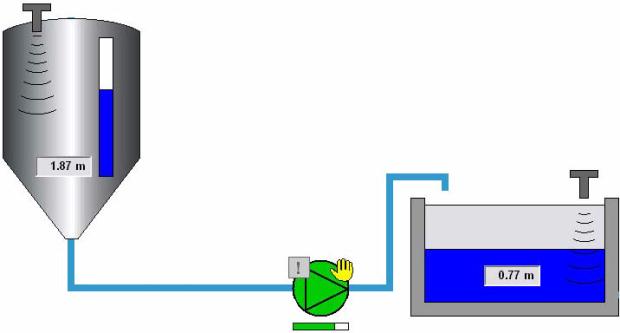
The next step will be to display the tank contents of T1 and T2 dynamicallyas fill level and also show the associated numerical values as text fields. Therefore, draw another bar (scaled rectangle) on the left side of the tank T1 and add text fields to both of the tanks.
-
Select the fill area (rectangle) in the open tank T2 on the right.
-
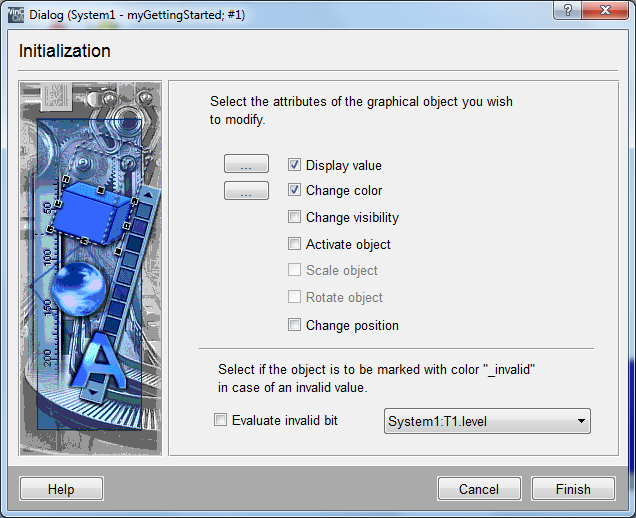
Configurethe scaling of the rectangle for theinitializeevent.
-
Skip the first step of the wizard (X scaling) using the associated button - the filling should only be scaled vertically (meaning in the Y direction).
-
Configure the data point element T2.level as source for the scaling in the Y direction.
Select the WinCC OA value range as base for this scaling. For the level 0 also the filling should be 0%. If the level is 1,4 m, the filling should be 100%. A scaling of 100% always means the drawn size (a similar value display by using a bar was already used for the rotation speed of P1 - therefore the configuration steps are the same as described in the chapter Dynamization of Graphic Elements.
-
Add a text field to the tank T2. Set the font to Arial - 10pt - bold. In the property sheet set the Enabled property to FALSE. The field should not be editable.
-
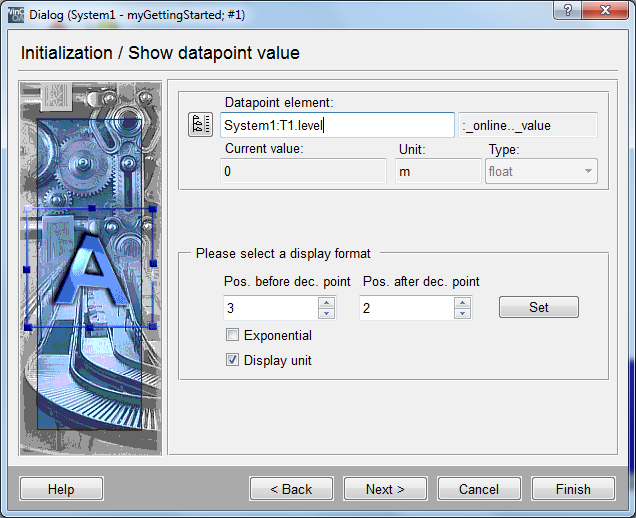
Configure a value display of the data point elementT2.level for the text field of the "initialize2 event. Also include the specification of the unit.
Now you have to prepare the corresponding graphic elements for the tank T1. For the graphical level display, a vertical bar (rectangle) will be used. The finished level display should look as shown in the following figure.
-
Draw a rectangle with a white filling and dark frame on the surface of the graphic of the tank T1.
-
Copy this rectangle and place it exactly above the first rectangle - for the upper rectangle select for the background the blue that was used for the filling of the tank T2.
-
Configure a scaling of the front, blue rectangle in the Y direction (skip the first step of the wizards) depending on the T1.level.
-
Add a text field and configure it the same way as you did for the tank2. However select T1.level as data source. The fill level is between 0 and 3m.


