The Testpanel "dp_monitor.pnl"
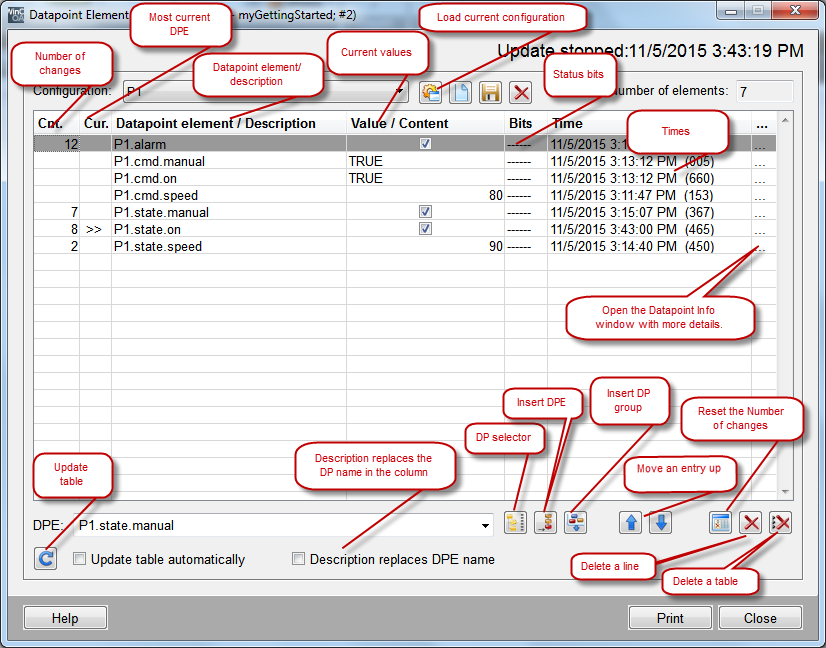
The data point monitor is a universal test panel that can be helpful when creating dynamic displays and device symbols. The aim is to display values of all data point elements of a data point clearly arranged and to be able to change these.
If the data point monitor is included in the symbol during the implementation phase of a device symbol, for example, for [right mouse click], you can test the behavior of a graphic or a script in the preview of the GEDI or in the user interface module VISION without additional effort.
By default the data point monitor will always be opened in its handy, minimized presentation. You can display the additional information in the right column through the scroll bar. With a [leftMouseClick] on the button >> top right, you can change to the full view (shown in the figure above).
The data point monitor displays all essential information of the completed process image. The view will be updated automatically when a value or state is changed. Thereby you can monitor the chronological order through the source time in the table and on the other hand through the highlighting of changes.
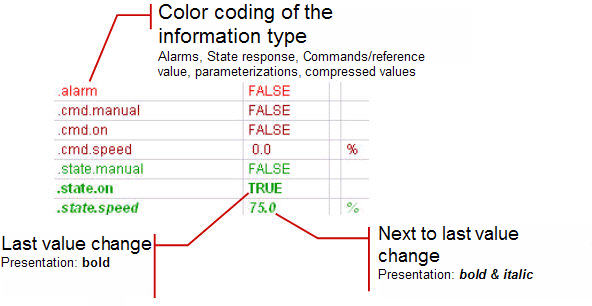
When the check box "Highlight last changes" is activated, the row with the last value change will be highlighted using bold font. The next to last change will be shown bold&italic. If several elements with same source times exist, all associated rows will be shown highlighted. If necessary you can also include a modification counter so that the number of value changes since the opening/activation can be displayed.
The data point monitor obtains the displayed information directly from the Event Manager. It does not only show the input in the current panel but also the actual process image. If you run a simple Simulation for the device behavior on the background, its impact can be monitored using the data point monitor.


