Water supply system
The Water supply system process display
(<proj_path>/panels/mainpanels/water_supply.pnl)
shows a scenario comprising several well houses, main sewers, reservoirs and a
distribution network. Several valves control the water flow into and out of the
reservoirs. Flow meters detect the actual quantities or cumulate the absolute quantities
into count values.
Figure: Water Supply System Process Display
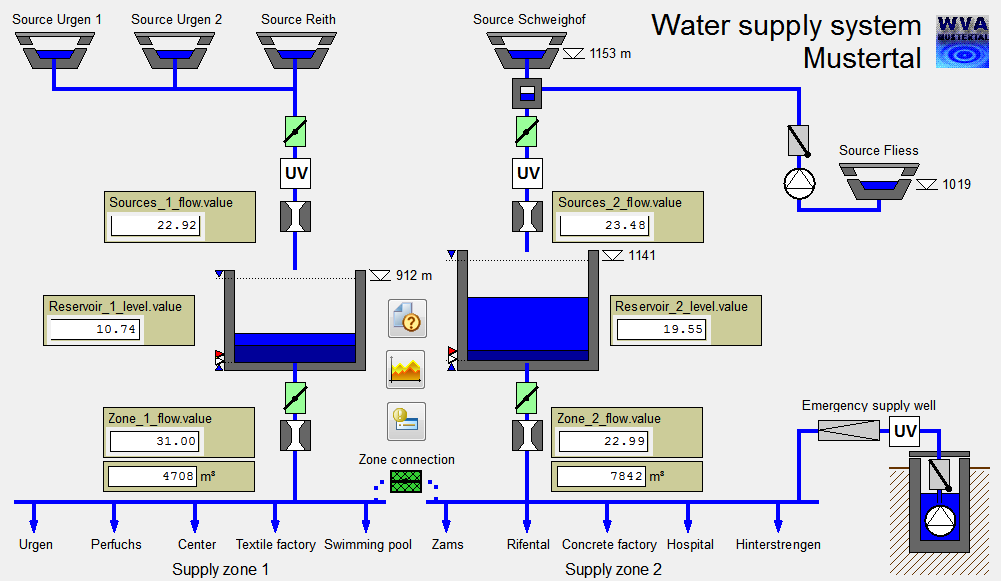
Clicking on the device symbols such as valves (slide valves), pumps or indicators opens an operating dialog. Right-clicking opens a context menu for configuration, simulation and advanced trend creation, where applicable.
All device symbols in this process display have been implemented using Complex standard symbols. These symbols are included in the WinCC OA objects and always work in conjunction with a complex data point, that is a data point with a tree structure (see also Data point concept).
One of the characteristics of complex standard symbols is that completely standardized dialogs are used and that the data points actually displayed are defined by the actual (enabled) peripheral addresses.
Simple operations
The following actions are possible activities when working with the process display:
-
Opening the operating dialog for one of the inlet valves and setting a new position.
-
Manually input a new reservoir level by right-clicking on a level indicator, selecting Situation in the popup menu, entering as value 0 in the field original value and confirming with ENTER. Trigger a depth alarm by selecting a very low reservoir level (see also Alert horn and Acknowledgement).
-
Clicking on the level-alert indicators (red and yellow triangles) at the reservoirs to show the set alert limits. Clicking on the blue level-limit symbols to display the value ranges. Clicking on the water surface shows the actual level for 3 sec.
-
Clicking on the completed trend symbol between the two reservoirs opens a sum trend (cumulative display) for the 5 min average of the consumption figures.
-
Clicking on the value display (for example, Zone 1 Consumption [m³]) to open the cumulative (count value) overview for one of the two cumulated consumption figures.
Special features
Complex standard symbols are very versatile objects. For instance, operating-time counters can be added to equipment with just a few mouse clicks (see also Basic information on the maintenance package). The calculation of real compressed values (for example, hourly averages, daily maximums, monthly sums) is already incorporated when using complex standard symbols.
Associated data point types
The following data point types are used in the water supply system:
-
ANALOG1: Analog values with compression levels
-
PUMP2: Pump objects
-
SLIDE_VALVE2: Valves (slide valves)
-
WH_SC1: Operating-time counters for the pumps
Structures and parameter settings can best be viewed in the PARA module. Open the PARA module by starting the last manager in the console list (see also PARA fundamentals). For details on data point types and data points, see the sections Data point types and Data points.
A very simplified process simulation has been implemented for the Water Supply scenario. This can be run from the Start cascade by selecting Settings in the Simulation option. When the simulation is running, the levels and flow rates depend directly on the valve settings and can be set manually (no feedback control).


