Weather station
The Weather station process display
(<proj_path>/panels/mainpanels/weather_station.pnl)
provides an overview of a typical measurement set-up. In the left of the panel is an
illustration of the actual measurement configuration, basically a tower with the sensors
for measuring different meteorological values, all erected near a shelter.
Figure: Weather Station Process Display
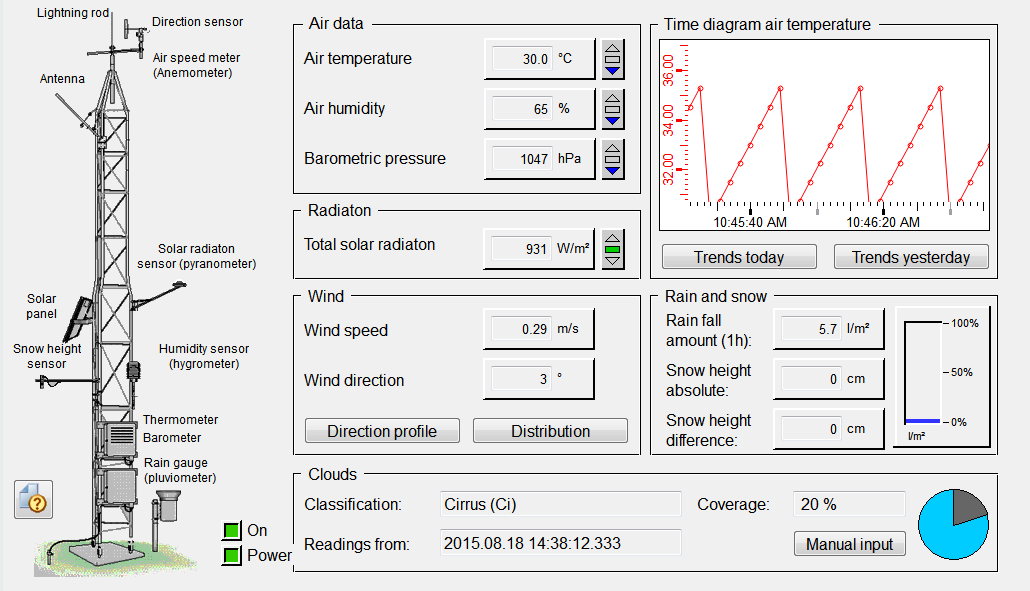
The Weather station scenario represents a class of visualization projects where user intervention is not necessary and the data simply is recorded and displayed.
While most of the data is recorded automatically in the system, the degree of cloud cover and cloud classification must be entered manually whereby data can be entered either at random times (for example, for the current time) or according to fixed schedules.
The entire scenario is executed using simple standard WinCC OA symbols. Everything, from the indicators with detailed reading displays to the temperature mini-trend diagram or LED symbols for the battery display, has been realized using prefabricated symbols (see Simple STD_symbols and References).
Simple standard symbols are not type-related. They can be linked to any leaf element of data points with any complexity in structure.
Simple operations
The following actions are possible activities when working with the process display:
-
Opening a dialog showing detailed measurements by left-clicking on the respective value display.
-
Opening one of the trend diagrams such as "Wind direction profile" or "Frequency distribution", see also Introduction to trend diagrams.
-
Manual input of cloud coverage and cloud classification data by pressing the Manual inputt button.
Special features
Apart from using simple, non type-related standard WinCC OA symbols, simple configuration is also used in the process display (see also Simple Configuration). This is a technique for animation or panel control in which the design is implemented entirely without programming or the need to write a script. The user simply configures the required animations or panel changes in corresponding dialogs.
This configuration method is used in this process display for opening the trend panels and the manual input panel.
The simple configuration function provided in the graphics editor is accessed from the Events tab of the Property Sheet for the selected object by clicking not on the button with the ellipsis [...] but on the area of the column in front of this.
Associated data point types
Data points of the following data point type are used in the Weather Station process display:
-
WEATHERSTATION
Structures and parameter settings can best be viewed in the PARA module. Open the PARA module by starting the last manager in the console list (see also PARA fundamentals). For details on data point types and data points, see the sections Data point types and Data points.


