Event table
The table for the events consists of six columns by default. The columns provide information about the data point whose original value has been set newly. The table is filled from the top down. Scroll bars automatically show when the table exceeds the available panel space.
Time
Shows the date and time of the event.
DPE / Description
Shows the data point element (description or name) whose value has been set (that triggered the event).
Value
Shows the online value of the data point element.
Contents
Shows the current alert text of the data point leaf. If a data point leaf does not include an alert handling, the value is shown.
Status
Shows the states for the status bits. The first four characters refer to the replacement value, for example, original value. The eight remaining characters are user bits (1-8). The filter in the property panel allows filtering by user bits. These are shown in the properties panel and can there be activated.
| Display | Status bits (EWIG12345678) |
|---|---|
| E--- -------- | E ...Replacement value was set |
| -W-- ------- | W... WinCC OA range violation |
| --I- --------- | I ... Original value is invalid |
| ---G ------- | G ... Value was set via a general query |
| ----1------- | 1 ... Userbit 1 |
| ---- -2------ | 2 ... Userbit 2 |
All set status bits are always shown. If, for example, E----1is shown, the replacement value and the user bit 1 are set.
...
Opens the "Event details" window. The window shows details for the event. Clicking the Close button closes the panel.
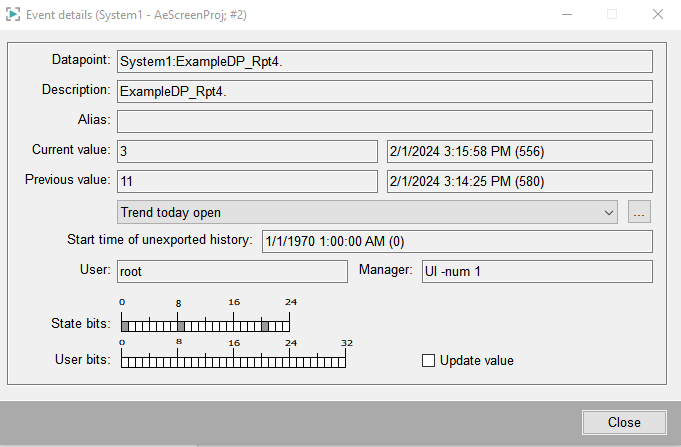
You can choose the time for a trend from the combo box.
![]() Displays the trend.
Displays the trend.


