View of the Alarm and Event Screen
Open the alert or the event panel through the System Management -> Diagnostics tab:
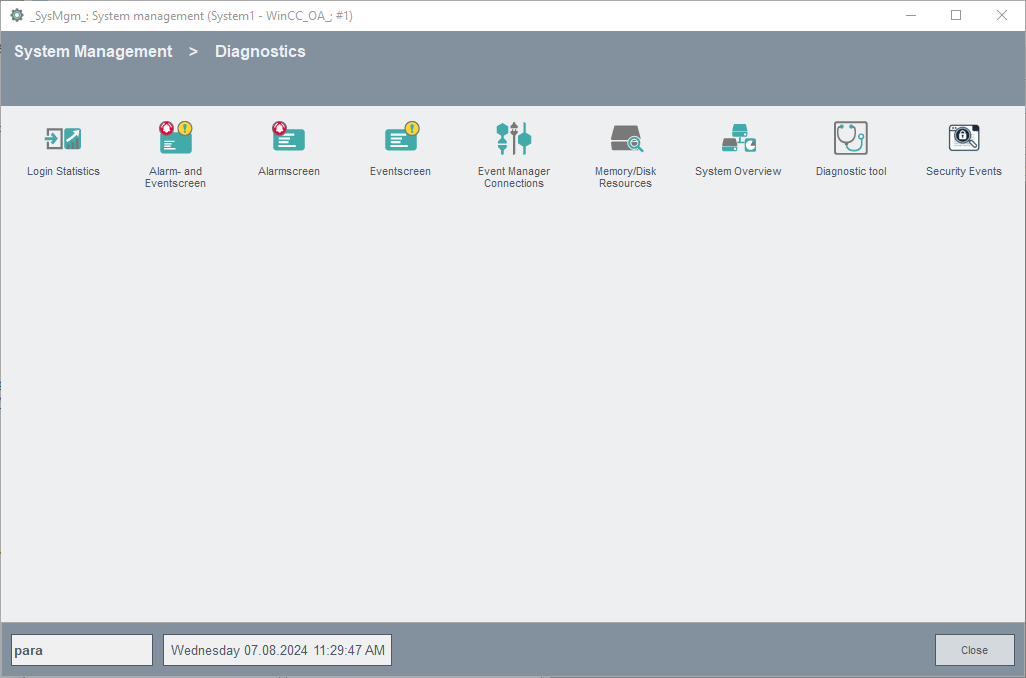
Click the Alert or Event panel button. The alert or event panel is opened with the default configuration. The alert and event panels can also be opened simultaneously. The following figure shows the alert and event panel with a specific configuration in the split mode. This configuration shows alert and event tables simultaneously.
The alert and event panel comprises two tables placed vertically above each other. Alerts are shown in the upper table and events in the lower table. The configuration of the panel can be changed through AES Config in the bottom right corner of the panel. The height of both tables can be changed by means of the slider on the right side. Under Linux, this slider does not exist and you use buttons for changing the table heights by scrolling the dividing line up or down. Click on the slider and drag it up or down to change the size of the tables. The two buttons above and below the slider maximize the selected table to full size. Another click on the button restores the original proportion of both tables. In this way, it is possible to use the alert and event panel in the full screen mode with one table only to display a maximum amount of data although both tables are active.
The lowest part of the alert and event panel is intended for displaying and changing settings:
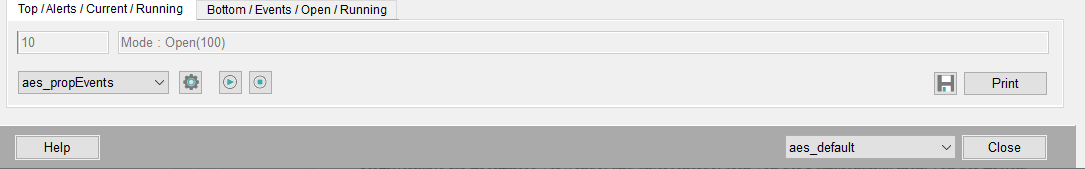
This area includes two tabs. The current displayed values/properties for a query are shown behind one tab (for the upper and lower table, respectively). Depending on the table focus, the right tab can be active as well.
All relevant information of a query in compressed form is shown behind these tabs. Furthermore, you can start and stop a query for the specific table with the two buttons at the bottom. The mode is reflected also in the tab heading as - Running, Current, Stopped. You can acknowledge all visible alerts and open the properties panel for changing the query parameters through this panel.
In the left text field, you can see the number of alerts as well as the number of unacknowledged alerts. The first number represents the number of alerts and the second the number of unacknowledged alerts.
The second tab is visible or invisible depending on the configuration. In the standard view, the second tab is used for events with the same functionality as the first tab.
When you choose a configuration from the AES Config combo box, querying the alerts is not started automatically. The query can, of course, be started via the "Start" button. Otherwise, the query is started only when you confirm the query with the OK button in the property panel. This enables you to modify a query before executing it.
-
 Saves the content
of the alert and event tables. The settings are saved in
Saves the content
of the alert and event tables. The settings are saved in
<proj_path>/data. -
 Prints the
tableNote:For printing the columns are adjusted to the print area. Therefore it may happen that the content of some columns is not completely displayed on the printout.
Prints the
tableNote:For printing the columns are adjusted to the print area. Therefore it may happen that the content of some columns is not completely displayed on the printout. -
 Starts
the query of the alerts or events (what query is started depends on the selected
table). If the connection between two distributed system is, a new server was
added or the DIST Manager has been stopped, then the play button in the alert
and event panel is displayed with a blue border. Thereby the user knows that the
data shown is possibly not up-to-date and the view in the table should be
updated (by a click on the play button). When you click on the start button, a
stop is automatically executed before the query starts.
Starts
the query of the alerts or events (what query is started depends on the selected
table). If the connection between two distributed system is, a new server was
added or the DIST Manager has been stopped, then the play button in the alert
and event panel is displayed with a blue border. Thereby the user knows that the
data shown is possibly not up-to-date and the view in the table should be
updated (by a click on the play button). When you click on the start button, a
stop is automatically executed before the query starts. -
 Stops
the query.
Stops
the query. -
 Use
the button to scroll backward in time. The button is only displayed in the
closed mode.
Use
the button to scroll backward in time. The button is only displayed in the
closed mode. -
 Use the button to scroll forward in time. The button is only displayed in the
closed mode.
Use the button to scroll forward in time. The button is only displayed in the
closed mode. -
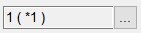 This
button is displayed only if your query is explicitly connected to other systems
or the "All available systems" check box in the "Filter system" tab of the property panel is activated. The
button shows connection information for the different systems. The numbers of
connections to the systems are given in the text field. The first number
represents the number of the actual connections and is followed by the number of
the configured connections. The asterisk indicates that you allow connection to
all available systems.
This
button is displayed only if your query is explicitly connected to other systems
or the "All available systems" check box in the "Filter system" tab of the property panel is activated. The
button shows connection information for the different systems. The numbers of
connections to the systems are given in the text field. The first number
represents the number of the actual connections and is followed by the number of
the configured connections. The asterisk indicates that you allow connection to
all available systems. -
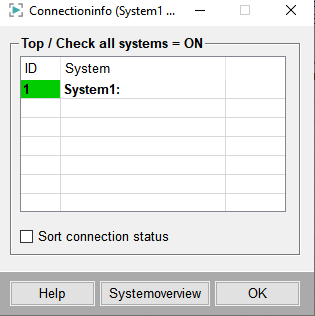
A click on the "..." button opens the connection information panel:
-
The property panel (see button below) allows configuring relevant changes in the view at runtime. You can specify what query is started, what mode is active and what filter settings should be used. You can also set, for example, the table inactive, specify the types of the data point elements for the upper and lower table. For detailed information about the property panel, see the chapter properties of the alert panel.
-
 Opens the
property panel (see properties of the
alert panel) for configuring queries in the alert and event panel.
This panel looks differently for alerts and events. This panel allows specifying
new content (what data should be queried).
Opens the
property panel (see properties of the
alert panel) for configuring queries in the alert and event panel.
This panel looks differently for alerts and events. This panel allows specifying
new content (what data should be queried).The content of a newly created configuration is specified in its own panel. The panel AES table configuration (see table configuration) opens through the AES settings button behind the Settings tab of the System Management. Through the table configuration, you define what the alert and event tables should look like, for example, what columns should be displayed.
The available configurations (the default configurations as well as the configurations created via the AES table configuration panel) can be selected from the AES Config. combo box. There are four configured configurations for the view of the alert and event panel by default (these cannot be edited or even deleted):
- aes_default: Shows the alert and event panel in split mode (see figure "Alert and Event panel").
- aes_alerts: Shows only the alert table in full screen mode (events are deactivated).
- aes_events: Shows only the event table in full screen mode (alerts are deactivated).
- aes_command: Commands from a visualization and control system are generally transferred to the periphery. For this purpose, own command data points are used (see chapter state signal simulation). This configuration shows all command data point groups with users.
To change the view of the alert and event panel, select a configuration from the combo box.
Notes and Restrictions
"Send buffer limit exceeded, closing
                    connection to (SYS: 1 Ui -num 7 CONN: 2) @ localhost,
                    [PeerItcIOHandler::sendCall]"
. The module VISION looses the connection
to the Data manager and establishes the connection anew. No answer is returned for
the query and the progress bar is shown. Further queries are not executed in the
AEScreen anymore. Close the panel and open it again. If the AEScreen becomes overloaded, the AEScreen first tries to display all values. If the load becomes too high for the AEScreen, values are buffered. If the number of buffered values is exceeded, values are discarded. The following error message is shown in the log viewer:
WCCOANV (3), 20XX.04.26 22:45:45.751, CTRL, SEVERE, 114, Values were discarded, Panel: vision\aes\AEScreen.pnl []
                    Object: 1 [table_top]
                    Script: EventInitialize
                    File: C:\Siemens\Automation\WinCC_OA\3.18\scripts\libs\aes.ctl
Line: 9813, aes_workCB, function has 1000 pending runs -> DISCARDING!##########
WCCILevent (0), 20XX.04.27 10:16:16.756, SYS, SEVERE, 39, Connection lost, Send buffer limit exceeded, closing connection to (SYS: 1 Ui -num 3 CONN: 1) @ localhost, [PeerItcIOHandler::sendCall]
WCCOAui (3), 20XX.04.27 10:16:16.766, SYS, INFO, 39, Connection lost, MAN: (SYS: 1 Event -num 0 CONN: 1)
##########


