Properties of the alert table
What data is shown in the alert and event table is defined in the properties panel. Filter criteria and other settings can be configured through this panel. Open this panel by clicking the button Properties in the alert and event panel.
The properties panel contains the following tabs: Timerange, Filter, Filter types, Filter status, Filter system, Sort, Visible, General and Extended Filter
as well as the following buttons:
 Creates a new property set. Enter
the name for the property set in the dialog.
Creates a new property set. Enter
the name for the property set in the dialog.
 Saves the settings of the property
set.
Saves the settings of the property
set.
 Deletes the selected property
set.
Deletes the selected property
set.
Properties
Settings such as timerange, filter criteria or sorting of data created in the tab panels can be saved by using a name. Click on the New property button, enter the name for the new property in the dialog and click on Save property. Existing property sets can be selected from the combo box and can be edited or deleted. To delete the property set, choose the configuration and click on the Delete property button. To edit a property set, select the property set. The property set can be edited through the tabs and saved by the Save property set button.
OK closes the panel and applies the changes made. Cancel closes the panel without applying any changes.
Timerange
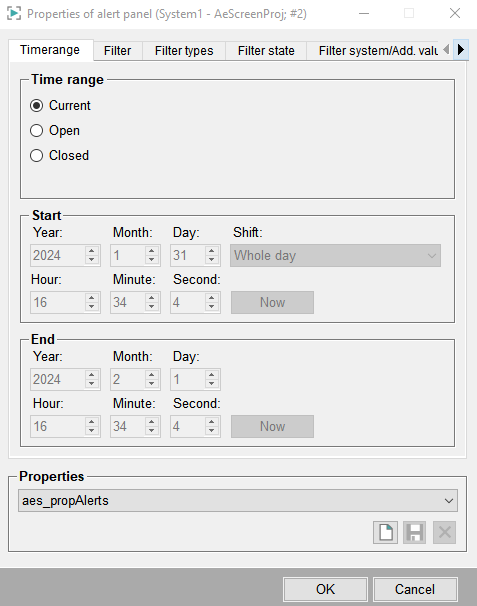
On the time range tab you can select the time for which the alerts should be shown in the alert table.
Current
The time range current shows all current alerts.
Open
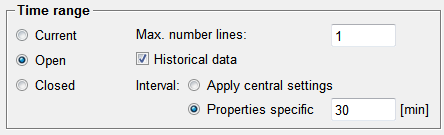
The time range displays as many alerts as defined via the option Max. number lines as of the time the filter has been activated.
For the open mode, you can check whether historic data should be displayed when the alert screen is opened. The interval for the historic data can be configured via System Management -> Settings -> Central settings -> Interval for historical data (open) [min] or you can configure it here (see figure below). The default interval is 30 minutes. If more data than the amount that should be displayed in the open mode is found, only the most recent data is displayed. Thus, you have an overview of the latest system messages, immediately after opening the panel.
Closed
The time range closed allows defining a fixed time period with defined beginning and end. The time period is selected from the combo box. The options Any day and Any time interval have to be specified by using the areas Start and End. In this case, the end time must be bigger than the start time. You can also define future dates as start and end parameters. With the Now button, the current time and date are used.
If you choose any of the options Today, Yesterday or Any day from the combo box, you can select different shifts.
Filter
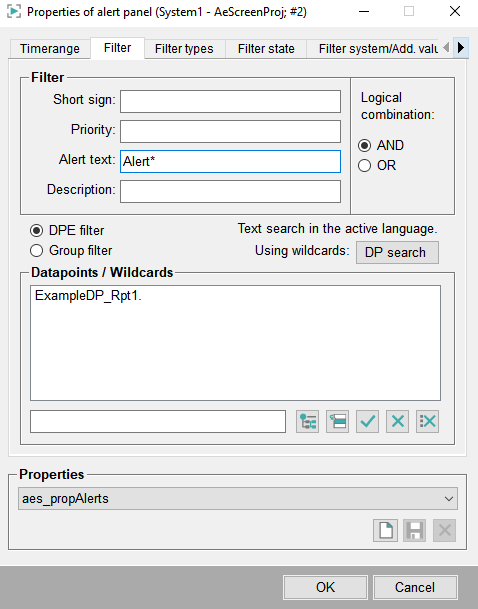
Specify a filter that allows filtering alerts by specific criteria.
Short sign
You can enter a short sign and filter by a specific alert type. The short sign is defined in the alert class. The alert class is specified in the alert handling of a data point element.
For example V for pre-warnings, W for Warnings or A for Alerts. You can also filter for several short signs. In this case, enter the two short signs separated by a comma. (for example, "A,B").
Priority
You can specify the priority of the alerts that you want to see, meaning that only the alerts with the specified priority are displayed. You can specify a single priority level, several priority levels or a priority range. The syntax corresponds to the syntax for the CONTROL function numberMatch().
For example 10 for priority 10, 10,20 for priority 10 and 20 or 10-30 for the priority from 10 to 30.
Alert text, Description
Wild cards ? (for one character) and * (for several characters) can also be used in the text fields for alert text and description. The syntax corresponds to the syntax for the CONTROL function patternMatch().
Only one filter criterion can be specified for the alert text and description filter.
Logical combination
The first three filter criteria (short sign, priority and alert text) can be logically combined by AND/OR, meaning that only the alerts whose short sign, priority AND/OR alert text correspond to the short sign, priority AND/OR alert text specified in the panel are shown. The description is combined with AND. Thus, if you, for example, define a filter description "Engine_Plant1" and a priority 20, an alert with priority 20 is only shown if its description is "Engine_Plant1".
DPE filter
Here you can filter by data point elements. You can also use CNS nodes and views for filtering (see DP selector, basics). You can also filter by data point elements of other systems, for example, by data point elements of different systems in a distributed system.
Using wild cards DP search
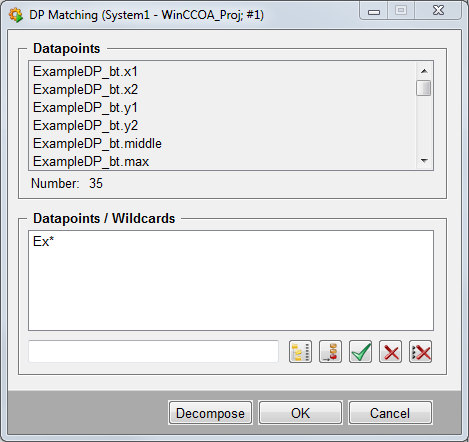
Here you define a DP search pattern with wild cards. A child panel with the searching result will be opened after clicking on DP search.
- Enter <pattern>* if all data point elements should be returned whose data point name begins with <pattern>.
- Enter *<pattern> if all data point elements should be returned whose data point name ends with <pattern>.
- Enter *<pattern>* if all data point elements should be returned whose data point name contains the <pattern>.
- Enter an exclamation mark "!" before <pattern> or the wildcard as prefix if all data point elements should be returned whose data point name does not contain the <pattern>, e.g. !<pattern>*, !*<pattern> or !*<pattern>*.
With Ex* (after adding the search criteria Ex* to the table) you would get the following results:
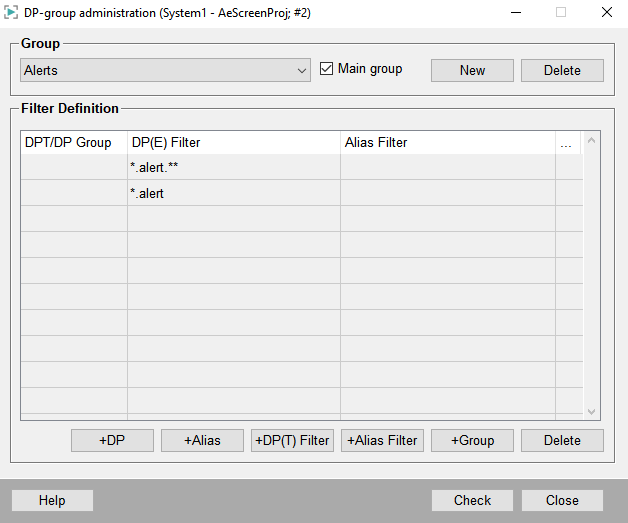
Group filter
Here you can use a data point group as filter (see data point groups). The standard main groups can be selected from the combo box by default. Add the entries by using "DPE filter", "Group filter" and for wildcards by using DP search, to the list.
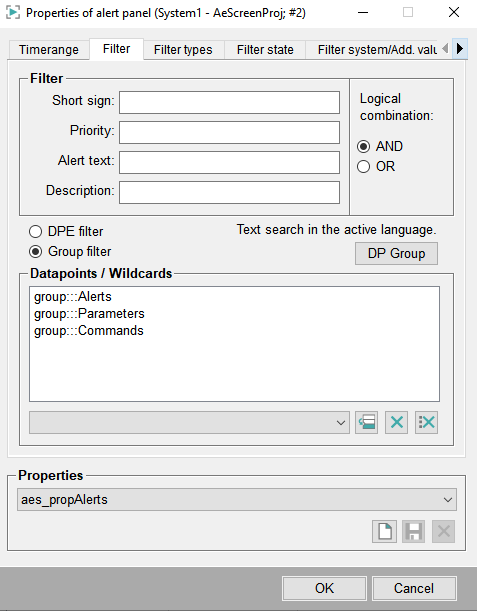
The DP Group panel opens by clicking on the DP search button.
The panel is opened for information purposes only and cannot be used for actual filtering.
Filter Types
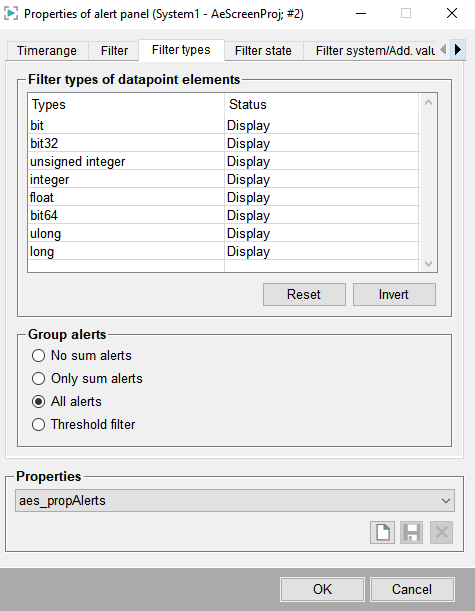
Choose specific types of data point elements that should be shown in the alert table. The listed types are logically OR combined.
In addition to the types also sum alerts can be shown or hidden.
Types/Status
The status of the type is changed by clicking on the row (status is displayed / not displayed). This table is OR combined.
You always have to select a type since the alert and event panel would not display any alerts otherwise.
Reset
If the reset is clicked, the status of all types is set to display.
Invert
Inverts the status of the types.
Group alerts
Is by default All alerts. Through the radio buttons you can select what alerts should be displayed. With the option No sum alerts, sum alerts are not shown in the alert panel.
Using the Threshold filter, you can activate the automatic filtering of alarms, meaning that you can set a limit value that specifies after how many individual alarms only the sum alert is shown (not available in the closed and open mode). If you would, for example, define the limit value 4 and there would be 4 alarms of this sum alert, only the sum alert would be shown in the alert screen. The limit value threshold filter parameter is specified in the alert handling of a sum alert in the PARA module. The filter parameter is specified on the alerts tab of a sum alert handling.
In the PARA module, you can additionally hide single alerts by using the filter check box of a sum alert handling of an active alert. Therefore, a sum alert is shown even though the limit value has not yet been exceeded.
When the alert reduction (automatic filtering of alarms) is used, you have to specify an alert class for the sum alert in the PARA.
The alarm reduction can be used in the current mode of the alert panel. It cannot be used in the open or closed mode.
Filter State
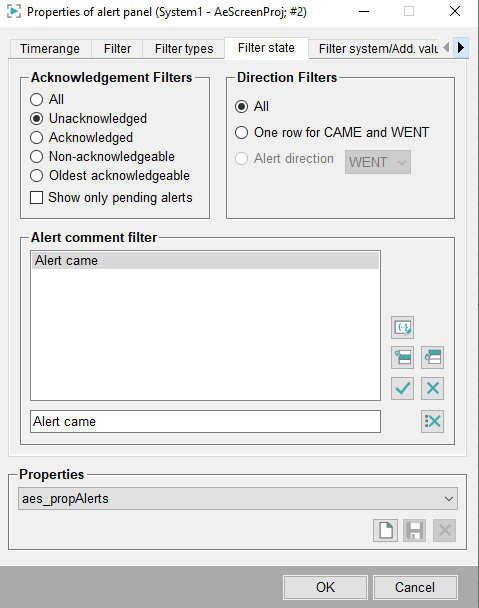
In the Acknowledgement Filters area you can adjust which alerts, depending on their acknowledgement state, will be shown in the alert table:
- All - all alerts are shown
- Unacknowledged - only unacknowledged alerts are shown
- Acknowledged - only acknowledged alerts are shown
- Non-acknowledgeable - only non-acknowledgeable alerts are shown
- Oldest acknowledgeable - only the oldest acknowledgeable alert is shown
If the Show only pending alerts check box is ticked, so only pending alerts will be shown in the alert table - acknowledged or WENT alerts are hidden.
See also _alert_class (Alert class) for information about alert saving and acknowledgement types.
The Direction Filters options depend on the set time range mode:
- All - all alerts are shown (CAME and WENT). Can be set for the time ranges Current, Open and Closed.
- One row for CAME and WENT - CAME and WENT alerts are shown in a shared row. If CAME and WENT are separately acknowledgeable and the CAME alert row changed to a WENT alert row without acknowledging the CAME alert before, so a dialog will be opened after trying to acknowledge the WENT alert. This informs that this WENT alert is not the oldest but it may be acknowledged together with the corresponding CAME alert (oldest alert). This collective acknowledgement works only for individual acknowledgements. This option can only be set for the time range Current.
- Alert direction - either only CAME or only WENT alerts are shown. This option is adjustable for the time ranges Open and Closed.
In the Alert comment filter area you can specify, which contents of a alert comment must be given or must not be given so that this alert will be displayed in the alert table.
Therefore a list of keywords will be defined, which will be combined with AND when filtering. That means that as soon as the first condition (keyword) will be identified as FALSE, the next keywords will not be checked anymore and the alert will not be displayed in the alert screen.
If an alert should be displayed, if a concrete keyword is not given in the alert comment, then the keyword must be preceded with an exclamation mark (e.g. !Acknowledged).
Alert A has the comment "Critical state - Acknowledged - Warning range reached - WENT"
Alert B has the comment "Warning range reached - Unacknowledged - WENT"
Alert C has the comment "Critical state - WENT"
-
Alert comment filter:
Critical state
!Acknowledged
Alert C will be displayed.
-
Alert comment filter:
WENT
!Unacknowledged
Alert A and alert C will be displayed.
Filter System/Add. Values
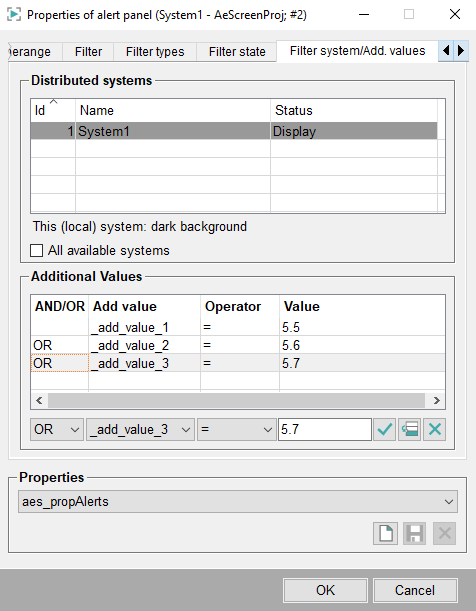
You can filter by single systems in a distributed system on this tab. All systems that are known at the moment are shown. Through the check box All available systems, the alert panel establishes a connection dynamically to systems that were not known during the configuration. Clicking on the list changes the status from display to not displayed(the selected system is hidden).
In the alert screen the alerts are displayed with the system name as suffix, e.g (dist_2), (dist_3).:
Additional Values
You can configure further conditions here. Alerts are shown in the alert screen only if the condition is fulfilled. The additional values can be and/or combined.
An alert can save up to 32 additional values that can be queried separately. These are addressable through config attributes and can be written individually to the _alert_hdl.._add_value_1 to _alert_hdl.._add_value_32 attributes
Sort
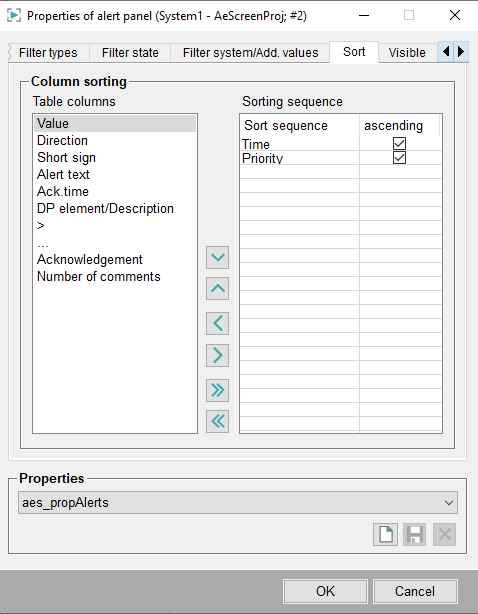
On this tab specify criteria that are used for sorting in the alert table. The alerts shown in the alert table are sorted by these criteria. The sort options in the list of table columns can be added to the list of the sorting sequence by double-clicking on the entry or by selecting the entry and clicking on the >>> button. You can also remove the columns from the sorting sequence by moving them back to the list of the table columns via the <<< button. The All >>> button adds all sort options from the left list to the right list. The arrow buttons allow changing the sequence of the sort options. The sort sequence ascending allows sorting alarms by time in ascending or descending order.
Visible
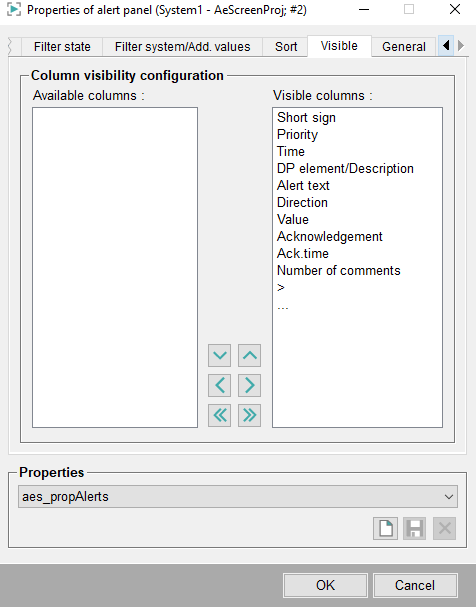
The visibility and order of the table columns can be configured on this tab. Only the columns that are set visible here, are shown in the alert screen.
General
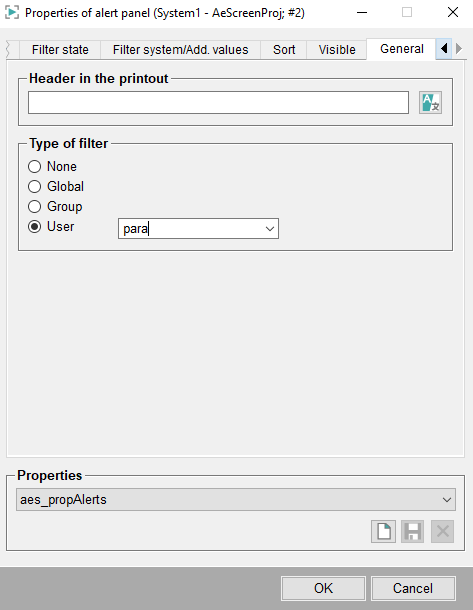
On the General tab you can define a heading for the printout of the alert table.
With the language button you can specify the heading in several languages in the case of a multilingual project.
In the section Type of filter you can decide which other users/groups may modify the properties of the alert table. The following types of filter are available:
- "None" - no one may modify the properties.
- "Global" - all global (root/admin) users may modify the properties.
- "Group" - only users of a defined group may modify the properties. The group can be selected from a combo box.
- "User" - only the selected user may modify the properties. The user can be selected from a combo box.
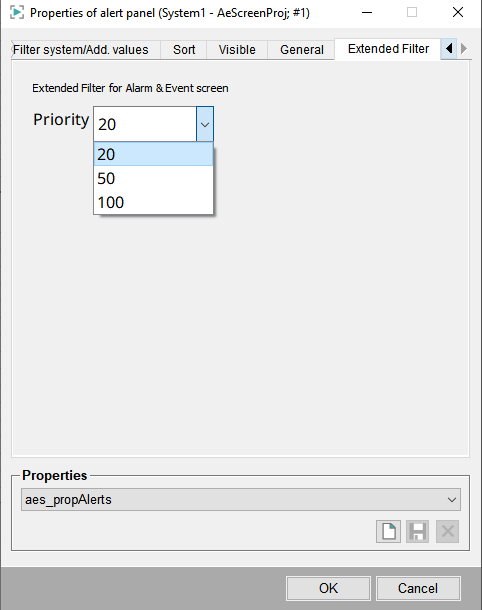
Extended Filter
On the Extended Filter tab of the Properties of alert panel you can implement extended filter options for alerts and events for your project.
The Extended Filters can be used to create own filter rules for filtering alerts or online and offline values of events. For alerts all alert_hdl config attributes can be used for the filter and for the events the attributes of the _online and _offline configs.
In order to provide Extended Filters, several steps are necessary. The following description contains the steps required to implement the Extended Filters.
- Set the config entry aesExtendedFilter in the [ui] section of the config file to
- 1 (the extended filter is used for the Alert Screen),
- 2 (the extended filter is used for the Event Screen) or to
- 3 (the extended filter is used for the Alert and Event screen).
- Depending on for which panel you want to use the filter, use one of the following panels:
for the Alert Screen: wincc_oa_path/panels/vision/aes/AS_propFilterExtended.pnl
for the Event Screen: wincc_oa_path/panels/vision/aes/ES_propFilterExtended.pnl
for the Alert and Event Screen: wincc_oa_path/panels/vision/aes/AES_propFilterExtended.pnl
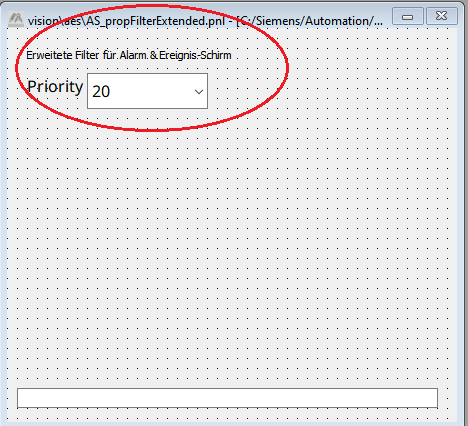
- Add a shape such as a combo box, a radio button or a list to a panel. In this example a combo box containing different alert priorities is used. If you use a combo box, add the alert priorities to the combo box (see above).
- Add, for example, the following code, to the "Changed" event of the combo box:
main()
{
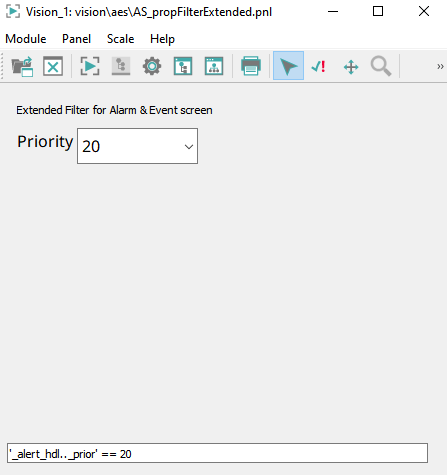
txtExtendedFilters.text = "'_alert_hdl.._prior' == " + COMBO_BOX1.text;
} - Open the panel via the console and enable the debug flag for the panel. NOTE
that the text field is only shown for the panel when the debug flag is enabled:
 -p vision/aes/AS_propFilterExtended.pnl -dbg
                        extendedFilter
Figure: UI manager and option for opening the panel as well as setting the debug flag
The priority is shown in the text field when a priority is selected from the combo box:
The priority can be selected on the Extended Filter tab of the Properties of the alert panel of the Alert Screen:
This example is used for the Alert Screen and only alerts with the priority 20 are shown in the Alert Screen. In a similar way, you can use other alert_hdl config attributes as a filter option. For the alert_hdl config attributes - see chapter _alert_hdl. If you want to filter events, use the attributes of the configs _offline and _online.


