Alert table
This page provides information about the default columns in the alert table. The appearance of the tables is not fixed but can be defined freely by users with appropriate rights. In this way, you can adapt the alert and event panel to the needs of your project.
The following columns are shown in the alert panel. The property panel allows changing the visibility of the columns.
Priority, Short sign
The first column lists the alert priority in form of a short code. Examples would be V for pre warning, W for warning, A for alert and D could indicate a disturbance. The next column shows the priority as a number.
In order to highlight unacknowledged and pending alerts, their priority columns are background colored. Blinking indicates unacknowledged alerts and stops with the acknowledgement of an alert. Pending alerts represent states reported as still ongoing. Therefore, these are always "came" alerts. The color represents the priority of an alert and the blink frequency indicates the particular alert direction. Light blue could display pre warnings, yellow warnings and red alerts.
The priority code, the blink frequency and the color are defined in the alert class. The alert class has been assigned to an occurring alert. Therefore, code and color can differ from those described for the predefined alert classes.
Time
The column "Time" shows the time when the alert occurred.
DPE / Description
The description of the data point element or when no description has been configured, the data point element of the particular alert, is shown in this column.
Alert text
The elements that caused the individual alerts are shown in the "Alert text" column.
Direction
The column "Direction" shows the alert direction of the value change causing the alert. The system distinguishes between "CAME" and "WENT" alerts. If the value of a variable exceeds or falls below the valid range, a "CAME" alert is generated for this range ("Prewarning"). If the value of the variable then exceeds the range for the prewarning, a "CAME" alert of the next range ("Warning") is generated. If the value falls below the lower limit of the warn range, a "WENT" alert is generated. If the value falls still further below the lower limit of the prewarn range, a "WENT" alert is generated for the prewarn range.
Value
The value column shows the value that triggered the alert or warning.
Acknowledgement
An alert can be acknowledged individually in the alert and event panel by clicking the "Acknowledgement" column. If this column is empty, the alert cannot be acknowledged. Alerts that can be acknowledged are represented by red exclamation marks on white background. In order to acknowledge several alerts simultaneously, select several rows while holding the shift or Ctrl key and acknowledge the alerts via a right click that opens a context menu.
| Display | Color | Meaning |
|---|---|---|
| !!! | Red on white background | Alert can be acknowledged (oldest alert of the data point element that can be acknowledged ) |
| !!! | Red on gray background | The alert can be acknowledged only after an oldest alert has been acknowledged. |
| X | Black on gray background | Alert was acknowledged individually. |
| XXX | Black on gray background | The alert was acknowledged as ConfirmAll. Meaning it was acknowledged together with other alerts at once (Common confirm). |
| --- | Black on gray background | The alert cannot be acknowledged anymore |
| <empty> | Alert cannot be acknowledged. |
If the user wants to acknowledge an alerts that is not the oldest alert of this data point element, the oldest alert has to be acknowledged first. A notification dialog warning that this is not the oldest alert is displayed.
With the config entry independentAlertAck= 1 in the [general] section of the config file you can set that alerts can be acknowledged independent of each other in any order - younger alerts before older alerts, CAME alerts before WENT alerts.
As soon as you click an acknowledgement column, the color of the column changes from white to gray. When the alert is then acknowledged system wide (this means as soon as the confirmation has been taken over by the control system), the exclamation marks in the column are replaced by an X or the acknowledged alerts disappear from the alert panel. What option is used depends on the acknowledgement type and the filter used.
The acknowledgement field in open alert queries can contain three dashes only. The three dashes indicate alerts that are not current anymore, cannot be acknowledged anymore and are not shown in the alert panel anymore.
- If you acknowledge alarms in the alert and event panel, a dpSet() to the _alert_hdl_ack config is executed. However, in case of a multiinstance alarm, this is not working. Therefore, the alarm is not acknowledged.
- Because of this, you have to use alertSet() to the _alert_hdl.._event
config. Here is an example how to acknowledge a multiinstance alarm (CAME):
alertSet(alertTimeCame, indexCame, dpName + ":_alert_hdl.._event", 4); - For more information about the _event config as well as its constants, see chapter _alert_hdl.
- You cannot acknowledge alerts in the closed mode. A warning message will be shown.
Ack.time
The " Ack. time " column contains the time of each acknowledgement.
Number of comments
This column shows how many comments exist for this alert. To add comments to an alert, click on the " Number of comments " column. The following panel for adding a comment opens.
The comment is entered to the input field and is applied via the OK button. Detailsshows detailed information on the alert in an information window. The Cancel button cancels the process and closes the Input comment panel.
>
Clicking on this column opens the panel that was defined via the alert_hdl config (see alert handling) on the Parameter tab. According to the settings, the process panel to be displayed can be opened as childpanel or in the appropriate module (see also Central settings).
...
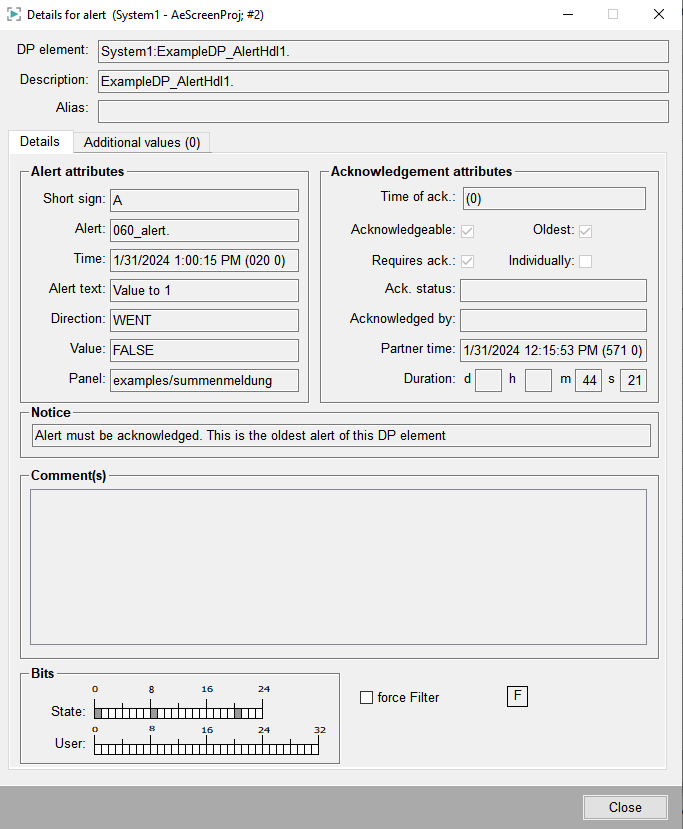
This column opens the information window " Details for Alert ". The window shows all the details for an alert. Close the information window by clicking on the button Close . Alternatively, the details for an alert can be viewed through the context menu that is opened by right-clicking on an alert. The figure "Details for Alert" displays details for a single alert. The figure "Sumalertdetails" further on provides details for a sum alert.
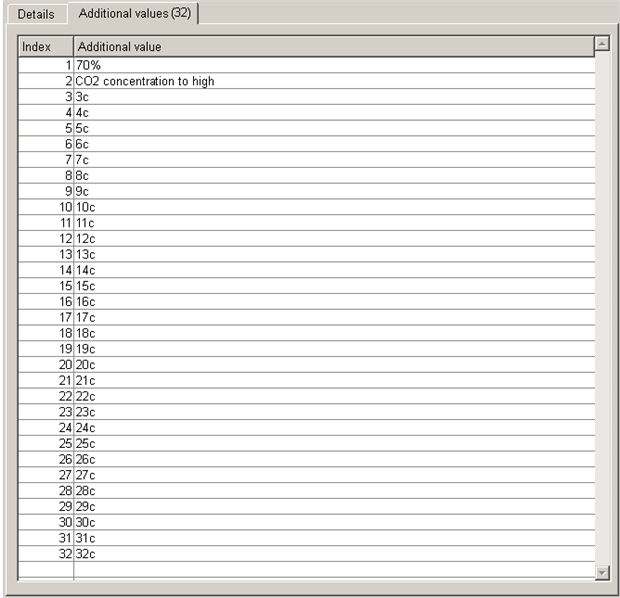
The additional values of the alert are shown in the Additional values tab.
The Index column shows the index of the additional value and the Additional value column shows the corresponding additional value. These values can be written separately to the attributes _alert_hdl.._add_value_1 to _alert_hdl.._add_value_32 or together to the _alert_hdl.._add_values attribute. It is not possible to set or change them directly in the detail panel.
The additional value with the index 1 can be displayed in the "Value" column and the additional value with the index 2 can be displayed in the "Alarm text" column of the alert screen, if desired and the additional values exist. This can be done by setting the attributesFromAddValues config entry.
Other additional values (or all additional values with "|" as separator) can be displayed in the columns of the alert screen by adding a new column with the option show a data point attribute (DPA) in the table configuration and selecting the corresponding attribute. For further information see Column configuration.
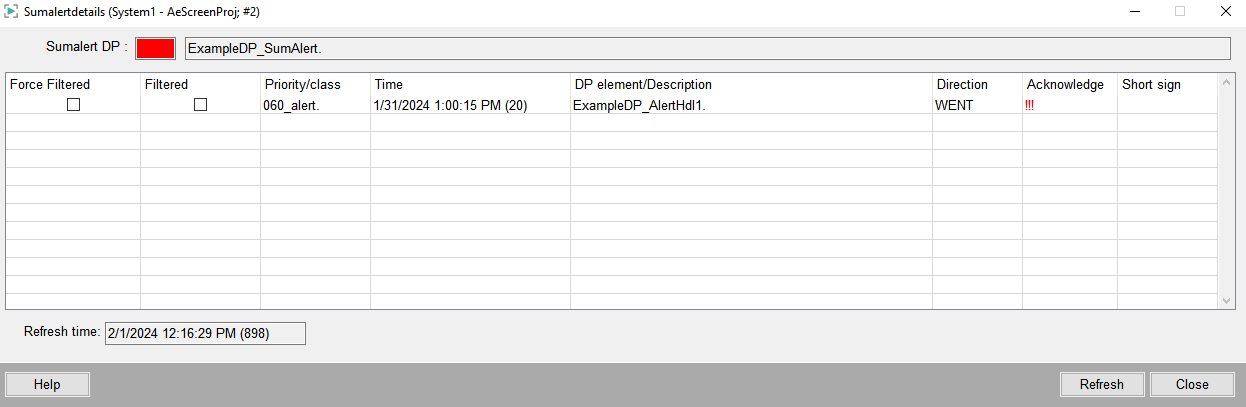
The column Filtered indicates whether an alarm was filtered meaning if the "alert reduction" was used. On the "Alerts" tab of a sum alert handling (inthe PARA module), you can set athreshold filter parameterfor the sum alerts. It is used to specify after how many single alarms the sum alert should only be raised. If, for example, the threshold 4 was set and there are four single alarms, only the sum alert is displayed in the alert screen. Thesumalertdetailspanel, however, shows the individual alarms and whether they were filtered, meaning whether the threshold parameter was used or not.
The check box Filter of a sum alert handling (in the PARA module) can be used to hide the individual alarms of an active alarm. In this way, only the sum alert would be displayed although the threshold was not exceeded as yet. Whether filtering was used or not is shown by the check box "Force filtered".


