Sum alert handling
Sum alert handling combines several individual alerts of several alert handlings.
- A sum alert is always sent when at least one of the assigned individual alerts occurs.
- Sum alerts allow you to link state displays with each other across several different panels.
- Sum alerts can be combined to make up other sum alerts.
If a system is displayed on several screens and levels, it is not always possible to see that a valve has failed by means of a flashing symbol. A group alert, on the other hand, displays alerts for all valves in ONE valve symbol. When this symbol flashes, it indicates that one of the valves included in the group alert has failed.
Sum alerts can be configured for non-numeric data point elements (string, struct, char, time, blob, DPID, LangString).
Whether the alert is a sum alert can be queried with dpGet() on the _alert_hdl.._type attribute. In the event of a sum alert the value 59 is returned.
Sum alert handling panel
The sum alert panel consists of three tabs.
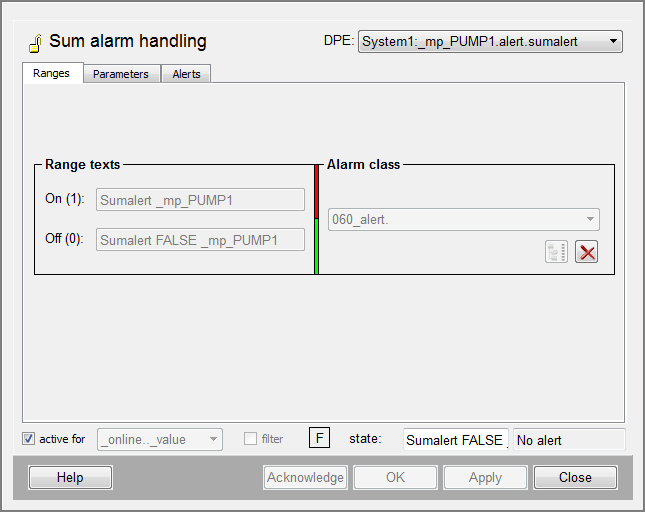
Ranges panel
- ON (1):enter a text that will be shown in the alert panel when an alert occurs.
- OFF (0): enter the text for the OK range. A group alert handling is in the valid range when all alert ranges covered are in "no alert" state.
- red range: A colored bar indicates the range in which the group alert is triggered (1).
- Alert class: assign an alert class to the alarm range. By default, there are 7 alert classes in the combo box. If a sum alert has been created without an assigned alert class, so the alert class of the related single alert with the highest priority is used. In this case the RDB manager does not archive the sum alert in the Oracle database. If the sum alert has an assigned alert class, this will be saved in the Oracle database correctly.
- X: deletes the selected alert class
Note:Do not assign an alert class to your sum alarm handling. It will then automatically assume the highest priority of its assigned individual alerts. However, you will need an alert class for any alert actions.
Parameters tab
You can adjust the following settings on the "Parameters" tab:
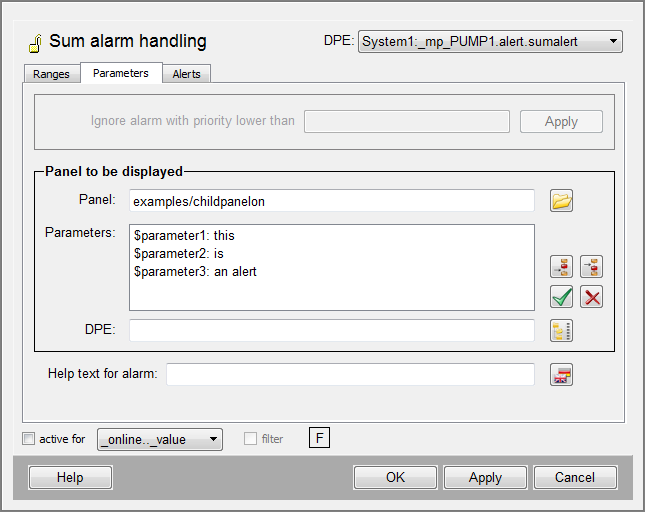
- Ignore alerts with priority smaller than:This option is not supported in case of sum alarm handlings.
- Panel: displays the file path of the panel to be displayed when an alert occurs. The path is specified relative to the panel directory. Click on the button to the right of the input box to display the file selector dialog box. Select the required panel there. In order to display the chosen panel, you have to click on the > column (panel name) in the alert panel. Another option is to click with the left mouse button on the appropriate row to open the context menu in which you have to select the entry "Processpanel". This entry is only visible when a panel to be displayed is configured.
- Panel parameters : here you can enter $-parameters to be passed when calling the panel. In the above example, three parameters are passed to dialog input boxes; if the panel is opened in the alert panel the warning is displayed.
- Default buttons for positioning items.
- Alert help: Enter a text to assist the user with information concerning the alert. This text can either be interpreted as "pure" text in the control script and displayed in the panel or also used as a file name (e.g. of an HTML file).
Alerts tab
Group alerts are non-acknowledgeable alerts that arrive when one of the individual alerts triggers an alarm. Group alerts are dismissed when each of the ranges covered are back in normal state.
- Although they generate non-acknowledgeable alerts, group alert handlings can have one of five alert states like other alert handlings.
- Alert handlings derive their alert state from the individual alert handlings assigned to them.
- Group alerts can order unacknowledged or pending alerts, as well as priorities, in different ways.
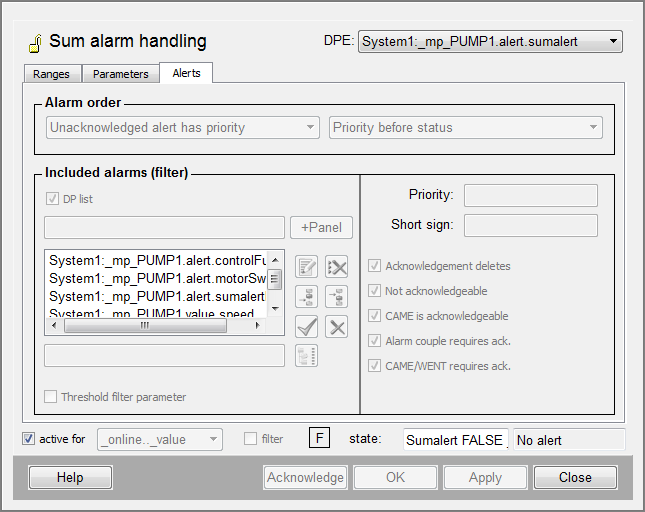
Alert ordering
In the combo box in the field Alert ordering click on the arrow next to the box display field to open a list of options:
- unacknowledged has priority sets alerts in the following order of decreasing priority: "came/unacknowledged" > "came/went/unacknowledged" > "went/unacknowledged" >"came/acknowledged" > "no alert". .
- pending has priority sets alerts in the following order of decreasing priority: "came/unacknowledged" > "came/acknowledged" > "came/went/unacknowledged" >"went/unacknowledged" > "no alert".
Because group alerts can also take different priorities into account, you must also specify whether the priority or the state of an alert should be ranked higher.
For example, this decides whether an alarm alert in the state "came/acknowledged" is ranked higher than a warning alert in the state "came/unacknowledged". Because priorities are characterized by numbers and short signs, the combo box in the field "Alert ordering" allows the following selection:
- Priority before state: Number before state
- Short sign before state
- State before priority: State before number
- State before short sign
Alerts considered (filter)
In the following section of the configuration panel ("alerts considered (filter)") you specify what alerts are to be added to the group alert handling.
This can happen, for example, if the data point element to which the processed group alert handling is linked is in a group alert handling itself that is addressed by a data point element covered. These group alert handlings would need to be manually deactivated in this case as they do not go after first occurring.
Data point list
If the check box on the left of the section is activated, it opens a list of addresses of all data point elements whose alert handlings you want to combine.
+Panel: Another way of addressing individual alert handlings is to reference panels containing acknowledgeable graphical elements. Such graphical elements have a list of all their acknowledgeable DP variables in the "Acknowledge" field.
- Enter the appropriate file path relative to the panel directory in the text box below the (selected) "DP list" check box.
- Click on the button +Panel to display the file selector dialog box with which you can specify the desired panel.
If you used $-parameters in the desired panel when addressing data point elements while configuring the state displays, you must resolve them.
To do so, use the dialog box that contains a text box for each dollar parameter in which you can specify what to put in its place: after clicking on the appropriate $-button, you can also replace the parameter with the aid of the data point selector dialog box.
- DP selector: The list items are entered in the field below the list. You can also use the data point selector dialog box to move them; this dialog box is displayed by clicking the button next to the input box.
Click on one of the five buttons next to the input box and the address list to set the order of the items.
Data point pattern
If the check box DP list is not activated you can reference data point elements using a pattern, i.e. an address with wildcards. This pattern is entered in the DP pattern text box. Allowed wildcards are question mark (?) that stands for one character, and the asterisk (*) that stands for any string of characters up to the next dot (.). Several entries are separated by commas and set in braces. In this case you always have to specify the system name.
Example: {System1:A*.Alert , System1:Z*.Alert}
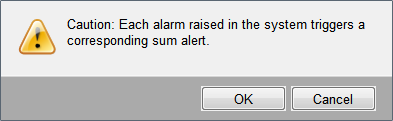
If only * is used as filter the following warning is displayed because the system might be overloaded:
Threshold filter parameter
With the threshold filter parameter on the Alerts tab you can set a threshold filter parameter for the sum alerts. It can be used to specify after how many single alarms only the sum alert should be shown. If e.g. the threshold 4 is set and there are four single alarms, only the sum alert is shown in the alert screen. The check box Filter can be used to hide single alarms of an active alarm. Thus, only the sum alert would be shown although the threshold is not exceeded.
If the threshold filter is set to -1, the threshold filter will be automatically adjusted to the number of included alerts. This means that a filtering will not be activated until all alerts are not pending.
Priority and short sign
In the right part of the filter section you can restrict the individual alerts to be taken into account to those alerts with certain priority numbers or short signs. In this way you can, for instance, filter alarms using the sign "A".
- Prio.Number : enter the filter to select alerts by priority number here. By entering several numbers separated by commas, you can filter all alerts that have one of these numbers as priority. Whole intervals of priorities can be filtered by numbers separated by hyphens ("1-3, 5" filters all alerts of priority One, Two, Three and Five.)
- Short sign : allows you to select alerts by their short priority sign. If you specify several signs, all alerts are selected that have one of these signs as their short sign. ("AW", for example, selects all alerts of priorities "A" and "W").
Acknowledge modes
By clicking on the appropriate button in the radio box you can restrict the individual messages to those messages with certain acknowledge modes. You can select a combination of the five acknowledge modes.
For more details on acknowledge modes, see chapter alert_class.


