Display trend
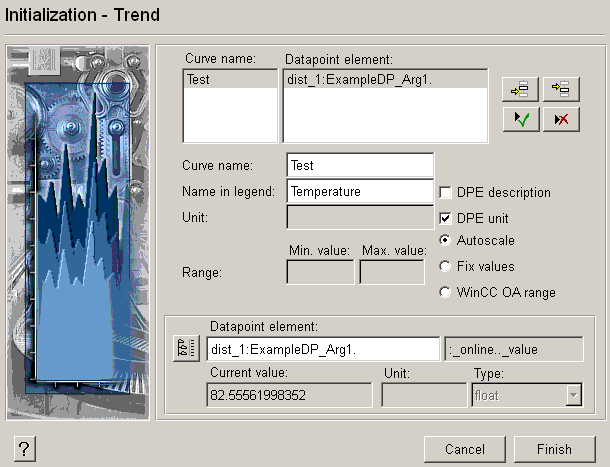
The panel Initialization - Trend can be used to assign data points to curve and legend names. The panel can be opened after creating a trend with the aid of the graphics editor. Click on the Open Property Wizard symbol of the "Initialize" event of the trend. The following panel opens:

Labels at the top of the panel
-
Name of curve : Curve names entered at the bottom are displayed in the list, for example, TEST.
-
Data point element: The data point elements entered at the bottom of the window using the DP selector or manually are displayed in the list. The values of the data point element are displayed as a curve.
The four buttons at the top right are used to add or delete data points.
If you change the label name or ranges of values, you have to apply the changes. Click on the button with the green symbol.
Labels in the middle of the panel
-
Name of curve: Enter here the name of the curve.
-
Legend name: Enter the desired legend label.
-
DPE description: if the selected data point element has a description, this can be displayed as a legend label using this option.
-
DPE unit: if the selected data point element has a unit, this can be added to the trend using this option.
-
Autoscale: The trend will be scaled automatically.
-
Fixed values: Specify values for the trend here.
-
Range, minimum, maximum: Enter the desired value range here (this means that only this value range will be shown. If there are values outside this value range, the value range (curve) will not be shown). When Autoscale or WinCC OA range have been selected, the fields cannot be edited.
-
WinCC OA value range: The WinCC OA value range is used for the trend.
Labels at the bottom of the panel
-
Data point element: displays the DPE selected with the DP selector (left).
-
-
Display current value, unit, type: displays the values and data point configurations of the selected DPE. (read-only!)
-
 Example
In addition to configuration in the Attribute Editor, the panel Initialization - Trend allows you to assign DPEs to legend names, curve names and ranges of values.
-
Create a trend in the GEDI.
-
Enter a curve name (for example, TEST) in the Trend Editor; do NOT define a data point element.
-
On the Common tab select the options Legend visible and Toolbar visible.
-
Click on Close.
-
Open the event "Initialize" of the trend using the Open Property Wizard symbol.
-
Select a data point element, for example, "ExampleDP_Arg1.". The related values are displayed below.
-
Enter the curve name that was specified before (TEST), a legend label (for example, Legend_Test) and a unit (for example, mm).
-
Select Fixed values, and enter 0 as minimum and 100 as maximum.
-
Click on the Apply button (green check mark) at the top right next to the list to accept the inputs.
-
Click on Finish.
Save your trend and open the panel in the VISION module. The trend curve displays the current values of the DPE and shows the specified curve and legend name. See the next chapter for more details on Customizing scripts.


