STD_INDICATORS
The STD_INDICATORS contain a number of indicator instruments but also offer you the possibility to display data points in trend displays.
| Symbol | Symbol name | Description |
|
|
3D_pie_chart | Display a float/int value as a pie chart (in %) globally colored |
|
|
3D_pie_chart_simple | Display a float/int value as a pie chart (in %). |
|
|
bar_1 | Displays a float/int value as a vertical bar |
|
|
bar_2 | Displays a float/int value as a horizontal bar |
|
|
bar_8 | Displays a float or integer value in the form of a bar. If the data point has an alert handling procedure, the top range of the bar is displayed red. |
|
|
pie_chart | 2 dimensional pie chart |
|
|
pillar_transparent | Displays a float/int value as a pillar (transparent) |
|
|
pillar_solid | Displays a float/int value as a pillar, with a height according to the value |
|
|
pillar_square_transparent | Displays a float/int value as a squared pillar (transparent) |
|
|
pillar_square_solid | Displays a float/int value as a pillar, with a height according to the value |
|
|
pointer_instrument | This symbol is used to display a value in the form of a pointer instrument. If the data point has an alert handling procedure, the top range of the bar is displayed red. Possible data types : integer, float |
|
|
pointer_instrument_2 | This (smaller) symbol is used to display a value in the form of a pointer instrument. If the data point has an alert handling procedure, the top range of the bar is displayed red. Possible data types : integer, float |
|
|
progress_bar |
This symbol can be used, for example, to signal a computing process. $dpe_value = 1 bar moves $dpe_value = 0 bar doesn't move. Possible data types : bool, float, integer (see showProgressBar(), openProgressBar(), closeProgressBar()) |
|
|
spinner |
The spinner is used to symbolize a rotation. $dpe_value = 1 spinner rotates, $dpe_value = 0 spinner stationary Possible data types : bool, float, integer |
|
|
tendency | Symbolizes,whether a float/int value (dpConnect()) increase or decrease. |
|
|
trend | This symbol is used to display a value in the form of an online trend display. |
|
|
wind_rose | Displays the angle of a float/int value (dpConnect); north = 0 °, south 180 °. |
bar_1
When you insert the bar_1 symbol into a panel, the reference editor is opened. You can also launch this editor from the property sheet.
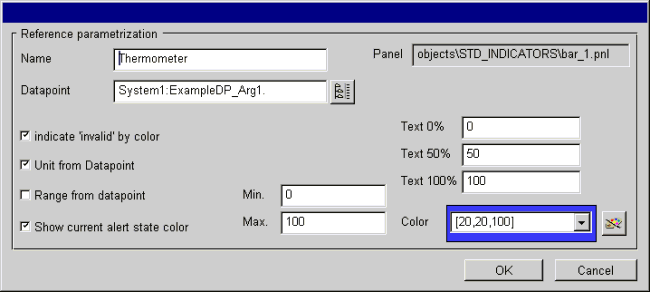
This panel displays the following:
Name: Enter a name for the object so that you can address it in a script.
Data point: Specify a data point element or use the DP selector to select one.
indicate "invalid" by color: If selected, this option the color of the bar changes to light blue (color _invalid) if the original values are invalid (invalid bit set).
Unit from Data point: Uses the unit from the _common config. Otherwise you can indicate a unit in the text field.
Range from data point: If you have configured a range for your data point element, if selected this range is used, otherwise you can specify Min/Max limits.
Show current alert state color: If an alert handling procedure has been configured for the DPE, the color of the bar changes to the alert color if an alert is pending. Otherwise the color of the bar stays the same.
Min, Max: Here you can enter limits for the display range.
Text 0% , Text 50%, Text 100%: Enter a text or a number for the display corresponding to the percentages (empty, half, full, 0, 50, 100, etc.).
Color: Specify a color or color string or select a color using the color selector. The Color selector is opened by pressing the button to the right.
In the Vision module, clicking on this STD_symbol bar_1 opens the following information panels:
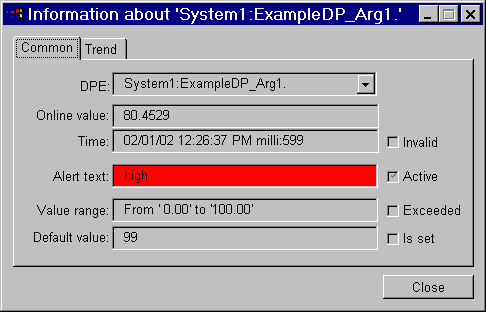
For DPEs, you can select between data point, alias and description from a combo box. The following are also displayed:
online value and its unit. The "Invalid" check box shows whether an invalid bit is set, thus rendering the original value invalid.
source time
alert text of alert handling; the flag indicates whether an alert handling is configured.
range and violation of this range (range exceeded).
default value and whether a default value has been set (e.g. for range exceeded).
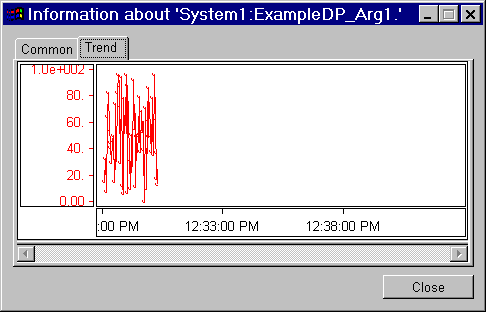
On a second tab you can observe the trend display of the related online value (e.g. you can use a STD_SIMULATOR to send a value to the same DPE):
trend
The trend symbol contains specific settings for trend display in its configuration panel.
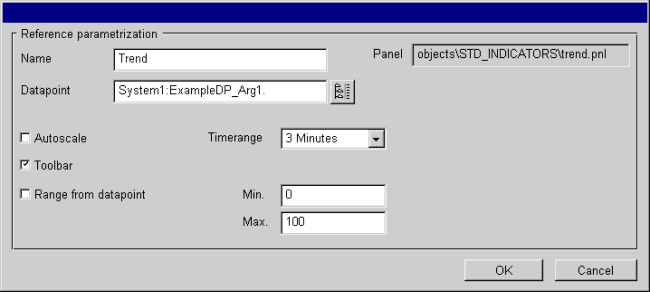
The configuration panel contains the following information:
Panel: Displays the directory path to the reference.
Name: Enter a specific name with which to address the object in scripts.
Data point: Specify a data point element or use the DP selector to select one.
Autoscale: Optionally, you can have the trend display scaled automatically, use the data point range or define any other range.
Toolbar: Option to display tools with which you can scale the trend display at runtime (see Vision/Trend).
Range from data point: Uses the scale defined according to the data point element range.
Min-Max: Here you can define a range.
Timerange: You can select pre-defined time ranges from this combo box.
OK:Saves any changes and closes the panel.
Cancel:Discards any changes and closes the panel.


