Sum trend
The sum trend
(<proj_path>/panels/vision/summation_trend.pnl)
displays up to 16 curves in the form of overlaid curve areas. In this case, the function
value for a sequence of values is not defined by the distance of the curve outline from
the time axis but is obtained from the distance to the next curve (that is, the width of
the colored band). The outer envelope in such a sum trend therefore represents the sum
of the individual function values.
These types of trend diagrams are frequently used in the utilities sector, particularly in the energy sector. It is an excellent way of displaying the generation or consumption of different units that either supply a common network or receive from it.
Figure: Sum Trend of two Consumption Values
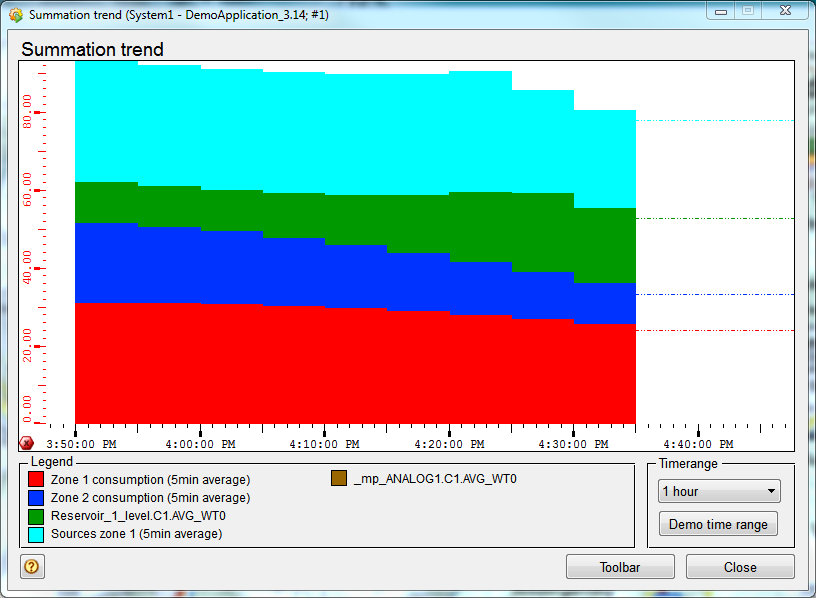
In the DemoApplication, the time range is always limited to a maximum of one day. Current time is reflected by the right end of the trend. The only exception is when a demo time range has been selected. The curves are only updated when they are opened, in the interim they do not display any new incoming values.
The curves are passed to the panel on opening as $Parameters (see also $Parameters). When setting the parameters, make certain that you use only positive values with the same units and the same time grid. For performance reasons, we recommend using only compressed values in sum trends, typically 5 min or 15 min average values.
A sum trend is created using the standard value-time trend widget and CONTROL programming.
In the Water Supply process display, you can open a sum trend for the consumption figures (5 min average values) by means of the button with the sum trend symbol between the two reservoirs.


