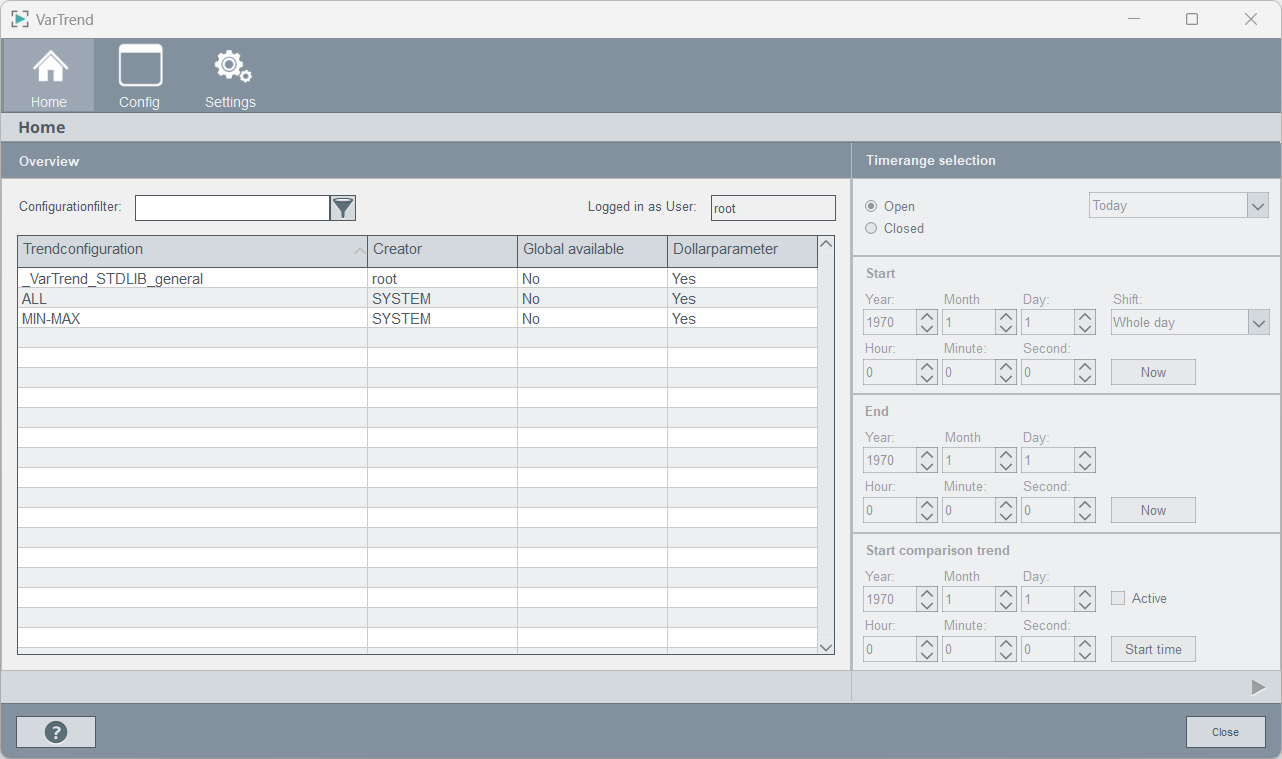
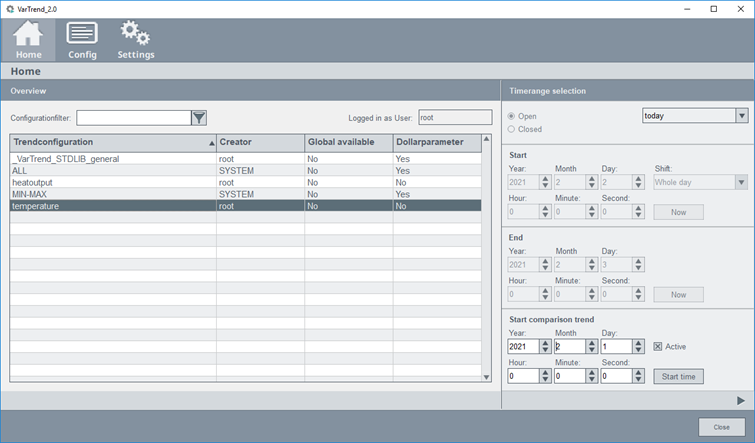
Panel for Selecting the Trend Display
Click the Variable Trend button to open the following panel. By default, two trend display groups are predefined as MIN-MAX, with 3 curves and ALL with 8 curves (these contain $-parameters and therefore cannot be displayed directly). You have to apply the "*" filter in the User combo box to show these groups.
All trend configurations with $curves must first be assigned data points before you can display them (see Example).
Every trend curve displays the value of the data point element assigned to it over time. A trend display group can display up to 16 data point elements together (for example, temperature kiln 1, level tank 3, and so on).
Although every user can use this panel to open and display trend displays, at least "para" authorization (userbit 4, see also User administration/ groups) is required if you want to create and edit your own trend display groups.
Internal checks of the consistence for older configurations can cause error messages. In order to avoid these messages, click each configuration (for example, when updating to version 3.0).
The select trend view panel contains the following controls:
Copy
Click on this button to duplicate and edit trend display groups, including the entire configuration, under a different name.
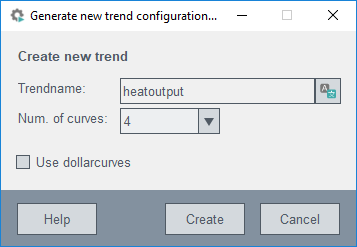
New...
Creates a new trend display group with one undefined trend display curve.
Up to 16 trend curves can be displayed.
How to create a new trend display group
- Click on the button
 in Trend
configuration editor panel.
in Trend
configuration editor panel. - Enter the desired group name and number of curves for example:
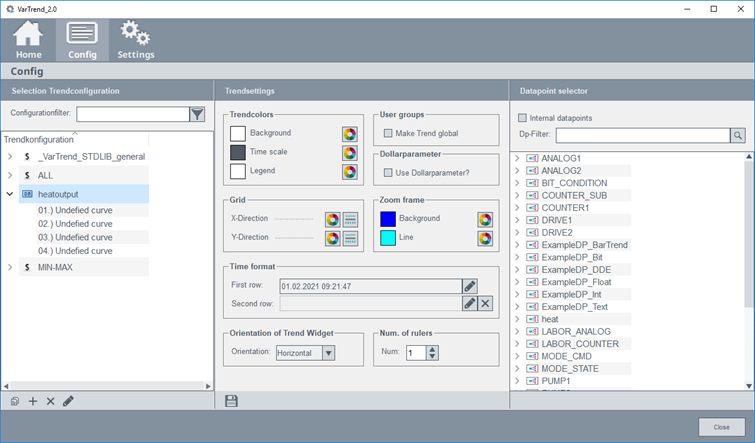
- Select the previously created configuration to change the settings.
- Open the corresponding drop-down menu and select the first curve.
- Click on the data point selector to add a DPE to this curve (e.g. waermeleistung_3.value:_original.._value).
- Allocate DPEs to all other curves (e.g. heatoutput_3.C1.AVG_WT0, ..C2.AVG_WT0
und ..C3_AVG_WT0).
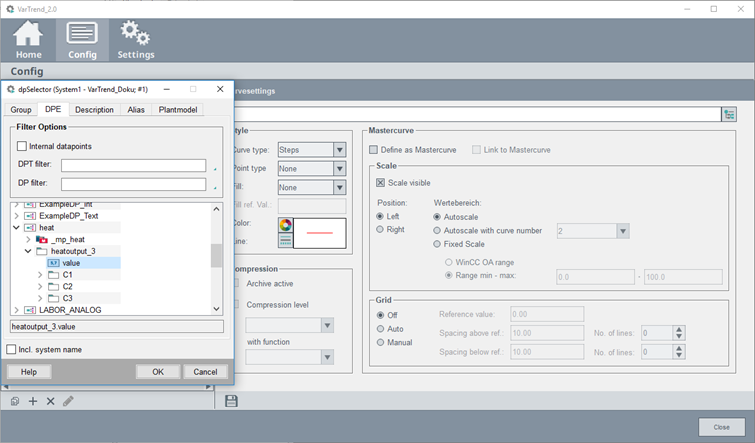
- Select a color, line style and scale (e.g. auto scale), etc. for every curve. Beware that for common scales (the auto scale with curve number option), only one scale will be displayed.
Delete
Permanently deletes a trend display group from the system. Any associated configuration is lost.
Edit...
Opens the central trend display group editor for editing and modifying trend display groups (see configuration).
User
Searches for a trend by user name (who created the trend). Only active users are shown in the combo box.
Trend configurations filter
Searches for a trend by trend name.
Time range
Following default time ranges are available:
- Trend today open
- Trend yesterday closed
- Trend selected day closed
- Trend this week open
- Trend last week closed
- Trend defined timerange closed
- Trend last 24 hours open
- 3 day trend open
- Trend defined timerange open (Default: 60 min)
- Trend last 1 hour open
- Trend last 8 hours open
For customizing the selected time range see Forward >
Forward >
You can freely select a different, more specific time range for the trend display to be opened in addition to the time range selected in the Time range combo box. In this case only, it is required to press the Forward > button.
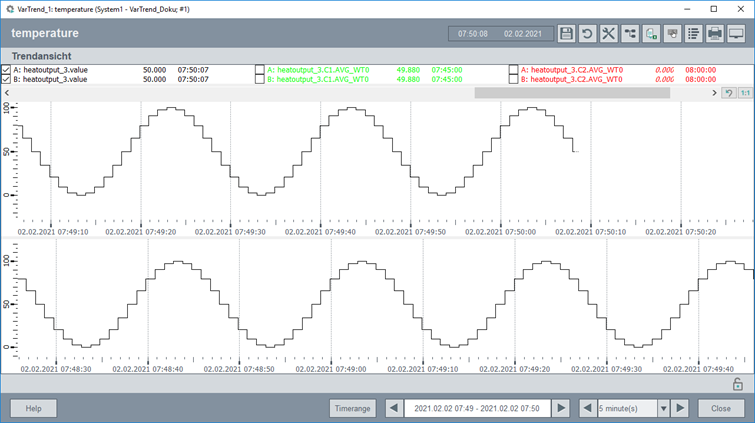
Time comparison trend
A time comparison trend allows displaying a curve with a time offset. You can compare the values of a day or any other time range.
- Activate the check box active in the "start comparison trend" section.
- Select a start time.
- For a synchronous start time click the Start time Button.
- Choose a day (comparison trend) that you want to compare with the day selected first (start time).
- Click the button
 to display the
trend configuration.
to display the
trend configuration.
The following panel compares the five minutes averages of two consecutive days for the data point heatoutput_3 (over a one hour period).
View
Shows the selected trend display group as a trend display for the selected time range.
Cancel
Closes the panel without sending the settings to the Variable Trend and without displaying a trend selection.


