Trend Configuration Editor Panel
This panel manages the trend configurations. New trend configurations, with up to 16 curves, can be created or existing trend configurations can be changed. The current user can only configure its own trend configurations, whereby users with root permissions can manage all trend configurations.
The settings are divided into three areas:
- Management of trend configurations: Create new trend configurations and add curves.
- Trend settings: Edit settings of trend configuration.
- Curve settings: Edit settings of a single curve.
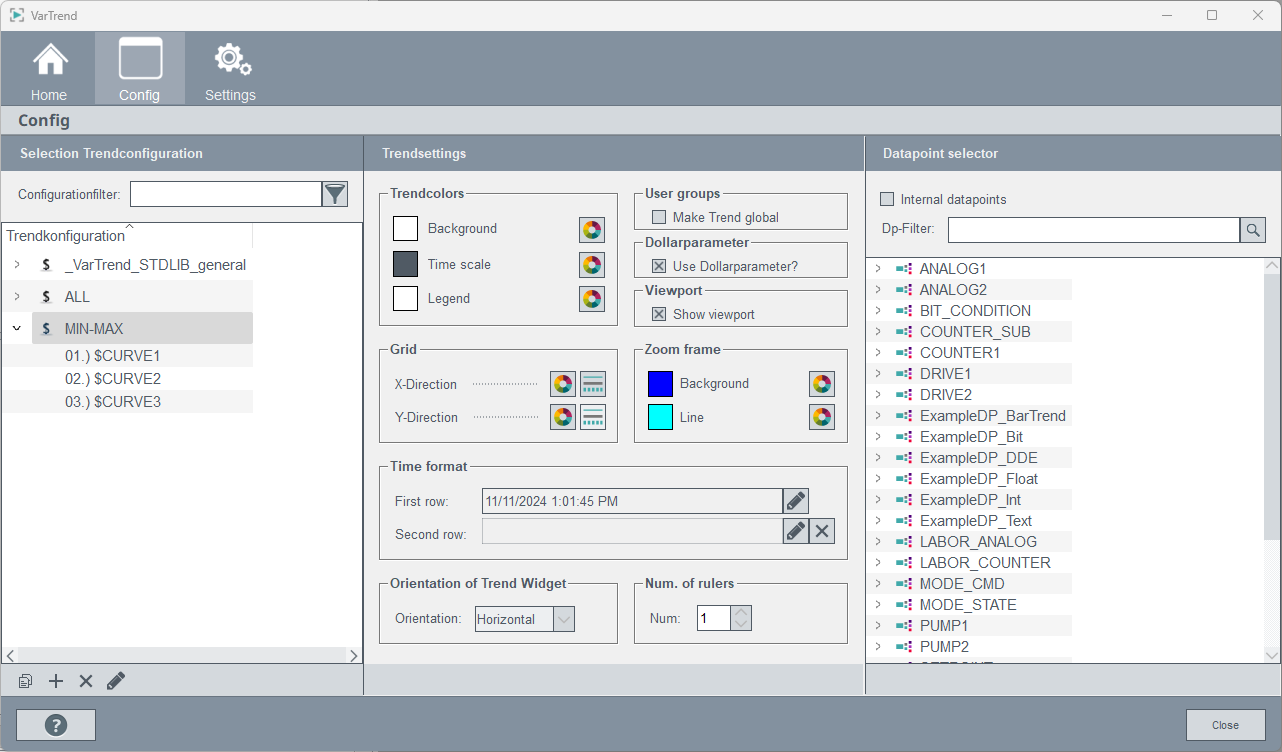
Management of trend configuration
On the left side of the panel is a list of all trend configurations available for the current user. To make settings on a configuration, it has to be selected. Opening the corresponding drop-down menu shows a list of the curves of the trend configuration. To make settings on a curve, the curve has to be selected first. Collapsing the drop-down menu de-selects the trend configuration
Configuration filter 
Filter trend configuration list by name.
Copy 
Copy a selection. When a trend configuration is copied, a new trend name must be entered.
New 
If there is no trend configuration selected, then a new trend configuration will be created. A dialog appears where the name, type and number of curves of the trend configuration has to be entered. If there is a trend configuration selected, then a new curve will be appended.
Delete 
Deletes the selected element. If a trend configuration should be deleted, the user has to acknowledge it first.
Change 
The name of a trend configuration can be changed.
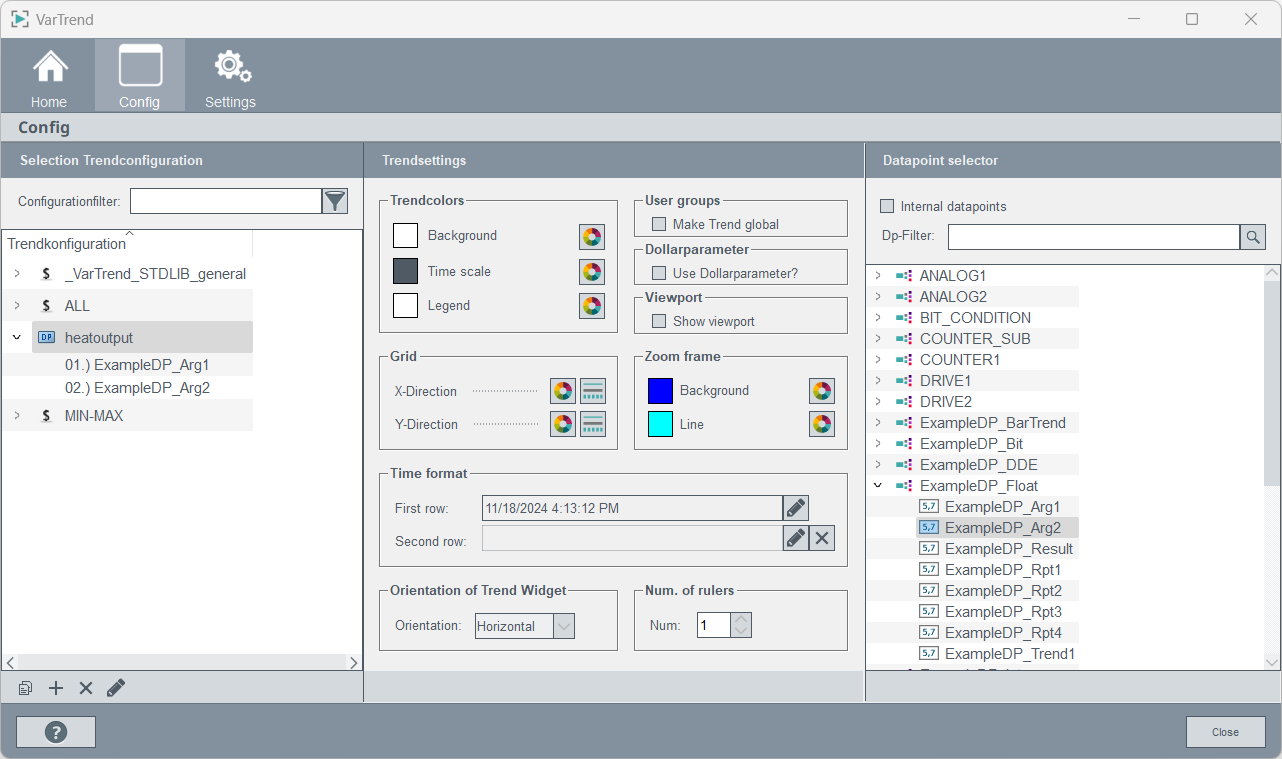
Trend settings
If a trend configuration is selected, the parameters of that configuration are displayed. In addition, a data point selector is also shown. This allows you to add curves to the current trend configuration by drag and drop. The individual sections of the Trend Settings are described below.
Trendcolors
Select colors for background, time scale and legend of trend view.
User groups
Select if a trend configuration is visible for all users. Settings is only for users with root permission available.
Dollarparameter
Convert curves from trend configuration. When setting is active, all curves use dollar parameter.
Grid
Select color and line style for grid lines.
Zoom frame
Select background and line color for zoom frame of trend view.
Time format
Define time format for time scale of trend view.
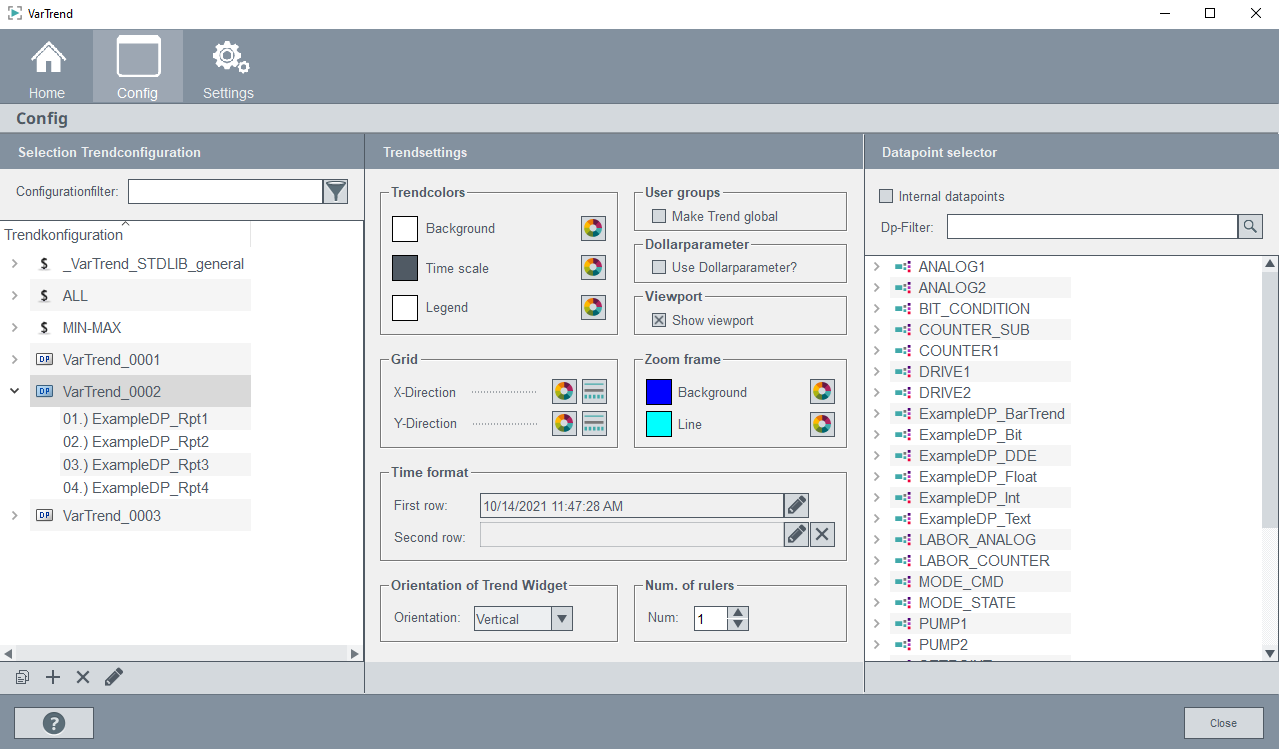
Orientation of trend widget
Select orientation of trend view.
Num. of rulers
Configure maximum number of rulers for trend view.
Viewport
This option defines if a small preview of the trend should be shown as part of the trendview.
Save 
All changed made to global trend settings are automatically saved.
Curve settings
If a curve of a trend configuration is selected, the parameters of that curve are displayed. The individual sections of the curve settings are described below.
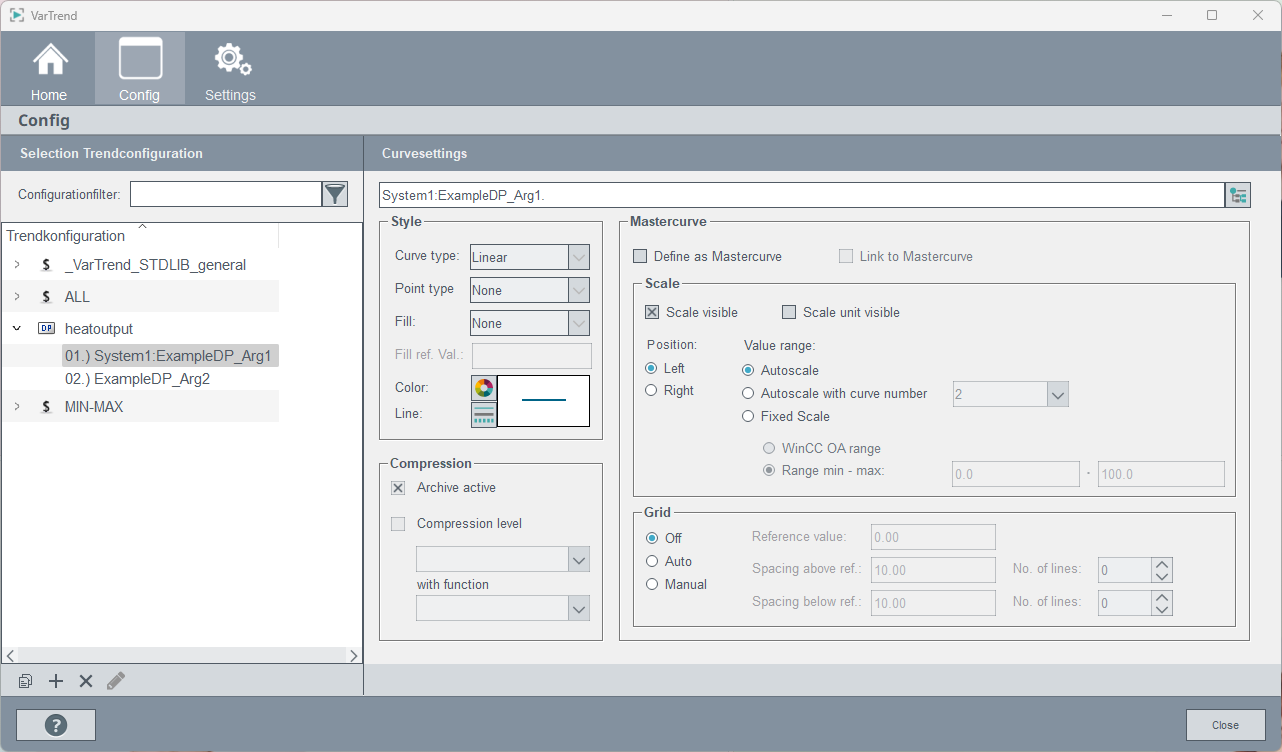
Style
This is where you select curve color, type and width.
- Curve type: Select the curve type: Points, Steps, Linear or Spline.
- Point type: Specifies how the trend should be shown: none, rectangle, x, +, *, o, Triangle, o filled, or triangle filled.
For an exact description of line type and color editors, see the corresponding chapter in the online help.
Compression
This is where you select the data point and any compression levels.
With the data point selector you can select a data point (element). If the data point (element) has automatic compression (see Archiving/Compression), you can edit the compression level to be displayed and the compression function of the trend display curve directly in the panel.
If the compression level has been set to "AUTO", the appropriate compression level is automatically displayed in the trend.
For example, a daily trend automatically displays the five-minute compressions and a monthly trend automatically displays the hourly values, if they exist, and other suitable compression levels.
Compressed at level
When you select a compressed data point, the compression levels are enabled. If the "AUTO" automatic compression level has been selected from the combo box, all compression functions in the data point are available.
If you select a function and then change the compression level, you can only select compression levels where the selected function has been defined.
For example, C1.AVG, C1.MIN, C2.AVG, C2.MAX are defined.
AVG, MIN and MAX can be selected in automatic compression. If you only select MIN and then change compression to C2, this does not make sense and is, therefore, not possible. When selecting the DPE .value, no compression levels can be selected.
Scale
This is where the user specify allocation and display of scales.
The check box Scale in trend display can be used to decide whether a curve scale is to be displayed in the trend display. It can thus be avoided to present identical scales.
The check box Scale in trend display can be used to decide whether the unit of a curve scale is to be displayed in the trend display next to the curve scale. The curve scale unit is defined by the unit settings of the selected DPE.
The position of the scale in the trend view can be set via the radio box “Position”. A distinction can be made between left and right.
The radio box Value range offers different selections how the curve scale should be displayed.
You can distinguish between:
-
Autoscale
Curves are automatically displayed with a range suitable for the data to be displayed
- Autoscale with curve number
The display is based on another curve. If curves refer to each other and if autoscaling has been activated, all corresponding scales are coupled. The range is set to the smallest and largest value of all related curves in the specified period.
Note:When a curve is autoscaled with another curve, the parameters of the selected curve are automatically applied.Note:If the minimum of a curve is lower than (minFLOAT()/2)+1e+304 or the maximum is bigger than (maxFLOAT()/2)-1e+304, the minimum/maximum is set to (minFLOAT()/2)+1e+304 / (maxFLOAT()/2)-1e+304.
- Fixed scale
Allows you to specify fixed minimum and maximum values for the scale.
- WinCC OA value range
The WinCC OA value range is taken as the scale. If the source curve is set to WinCC OA or fixed range, this applies to all related curves. This can result in values outside the defined range not being displayed (see WinCC OA range).
Grid
In this section the grid lined of a curve are configured. The user can choose between following options:
- Off - No grid lines for this curve.
- Auto - Grid lines align automatically.
- Manuel - Fix grid lines for curve. The reference value, the spacing and the number of lines above and below the grid lines must be specified.
Mastercurve
In this section a curve can be defined as master curve or linked to a master curve.
To define a curve as master curve the check box „Define as master curve“ has to be active. The master curve is a template for other curves.
To link a curve to a existing master curve the check box „Link to master curve“ has to be active. The curve uses settings for scale and grid lines from master curve.
Save
All changed made to global trend settings are automatically saved.


