Example of trend configuration
The following example demonstrates how to use the Variable Trend to create and configure a trend display group for a compressed data point.
Requirements:
Using the archival and compression panel (open the panel by selecting in turn. See also Archiving/Compression), create a data point type with 3 levels of compression and create a data point of this type.
- For this example, you have created a data point type called heat and a data point heatoutput_3.
- To the data point heatoutput_3, assign a sine function as _original.._value using the standard object "SineSim" (For the STD_SIMULATOR, open the standard object catalog in the graphics editor by selecting in turn . This curve displays all current values immediately. For the curves of the associated compression levels, the duration of display depends on the interval. For example, values of a five-minute interval, at the earliest, are displayed only after five minutes and new values are only displayed every five minutes. This must be taken into account for long intervals (weeks, months).
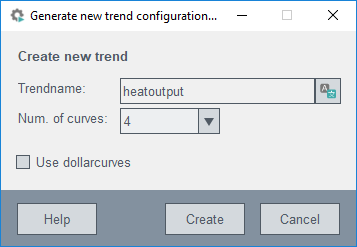
How to create a new trend display group
- Click on the button
 in Trend
configuration editor panel.
in Trend
configuration editor panel. - Enter the desired group name and number of curves for example:
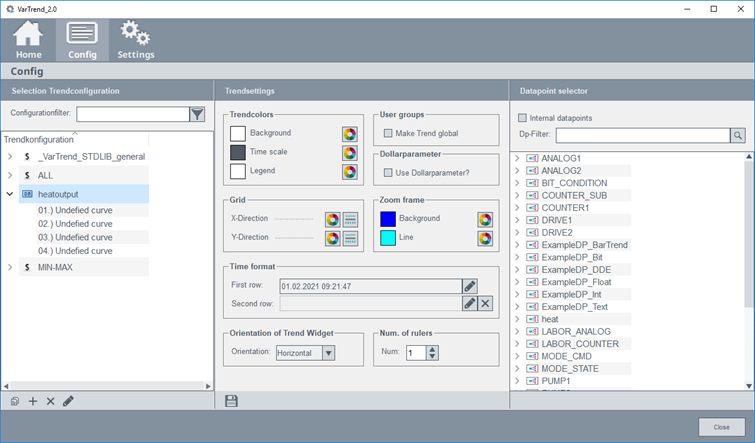
- Select the previously created configuration to change the settings.
- Open the corresponding drop-down menu and select the first curve.
- Click on the data point selector to add a DPE to this curve (e.g. waermeleistung_3.value:_original.._value).
- Allocate DPEs to all other curves (e.g. heatoutput_3.C1.AVG_WT0, ..C2.AVG_WT0
und ..C3_AVG_WT0).
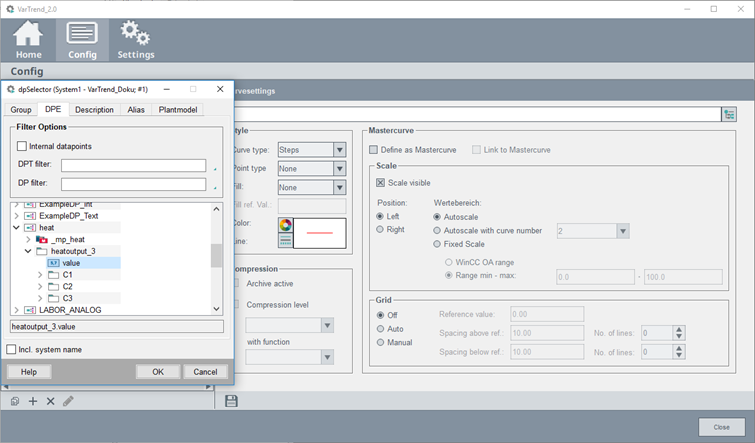
- Select a color, line style and scale (e.g. auto scale), etc. for every curve. Beware that for common scales (the auto scale with curve number option), only one scale will be displayed.
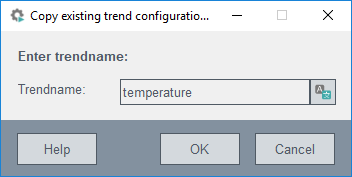
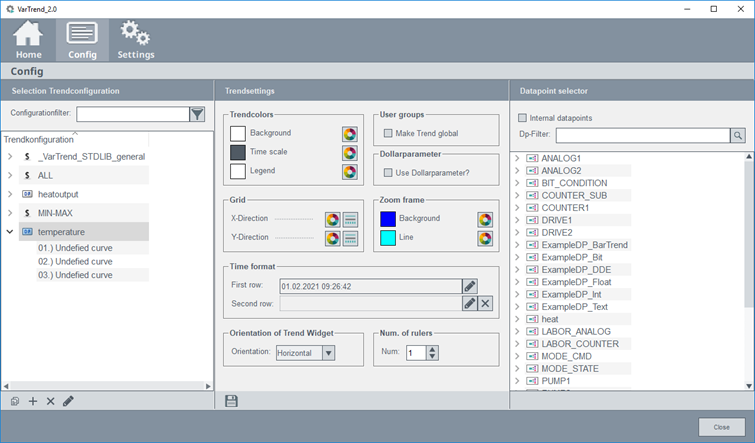
Using the predefined trend display group
- Select, for example, the MIN-MAX trend display group.
- Click Copy and enter a name, for example, Temperature
trend. The entire MIN-MAX configuration will be applied.
- Select the trend configuration to see all trend settings.
- Unlock the $parameters by deactivating the Use $parameters option. The curve's name becomes now undefined curve.
- Select for each curve the data point element whose trend display you want to
see, for example, the current value of the data point element heatoutput3.value
for curve 1. For the other curves select, for example, the mean of the first and
second compression level.
- Switch to the menu point HOME and open the trend
configuration.
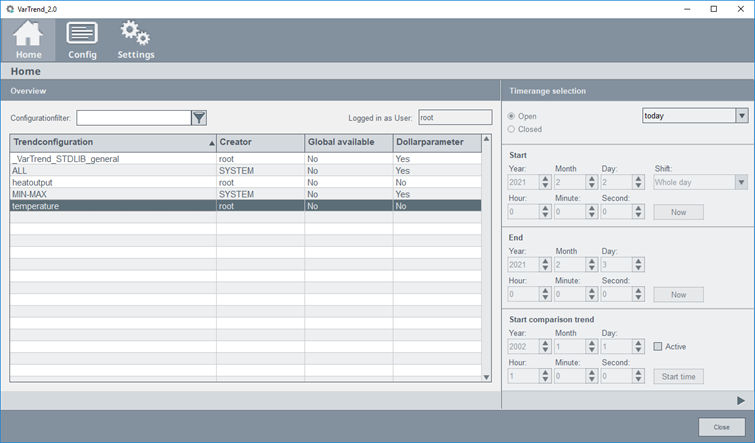
Change display mode
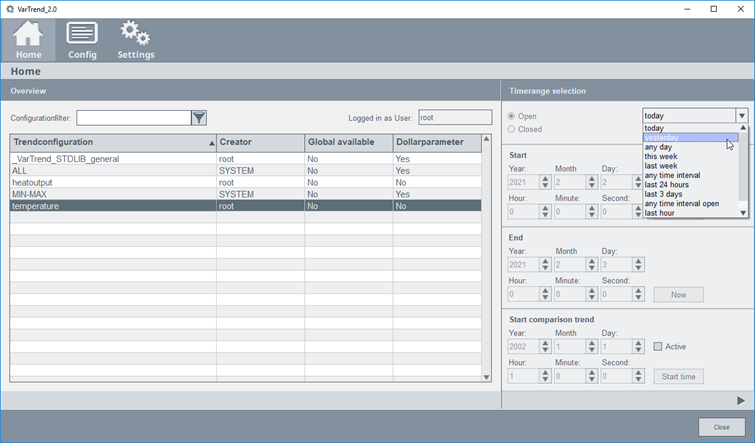
- Select the trend configuration from the table.
- From the combo box select the desired period, for example, any time interval.
- Enter the desired period below.
- Click on the button to open the trend configuration.
Time comparison trend
A time comparison trend allows displaying a curve with a time offset. You can compare the values of a day or any other time range.
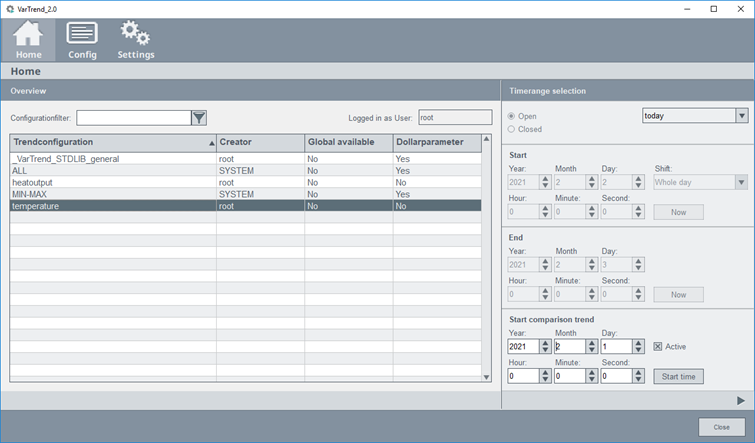
- Activate the check box active in the "start comparison trend" section.
- Select a start time.
- For a synchronous start time click the Start time Button.
- Choose a day (comparison trend) that you want to compare with the day selected first (start time).
- Click the button
 to display the
trend configuration.
to display the
trend configuration.
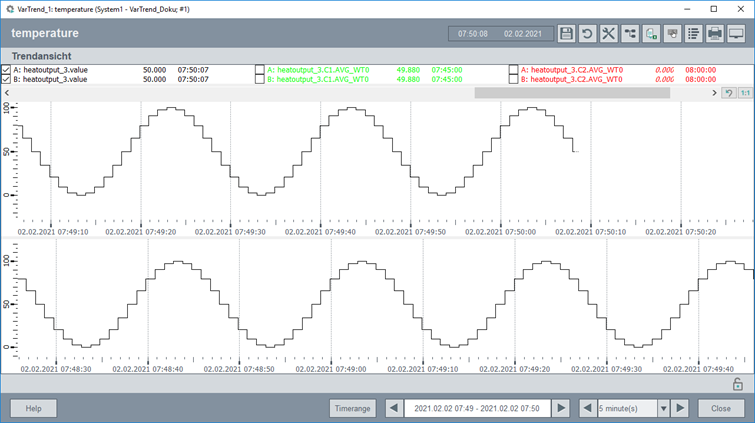
The following panel compares the five minutes averages of two consecutive days for the data point heatoutput_3 (over a one hour period).
Other applications
Trend display from a panel
Display the daily trend for any reading in a process display.
In order to do so, map a Variable Trend call with data point as parameter to a button (see also openTrend() and openTrendCurves()).
The Variable Trend automatically opens in a new module and displays the desired information (for example, five minute values together with an hourly envelope curve of minimum and maximum values).
Example
Select the predefined trend display group Temperature trend to display it as today's trend:
main()
{
  openTrend("Temperature trend", 1);
  /* the first parameter designates the trend display group, second parameter designates the period. 1 = today`s trend */
}
Free selection from a list of curves
In a particular project, you want to select curves and then display them all together.
In order to do so, map a Variable Trend call with the curves as parameters to a button.
The Variable Trend displays up to 16 curves in different colors in the specified display mode.
System overview curves
You want to display the key system curves in one trend display.
In order to do so, define a trend display group that shows the key readings (for instance, inflow, outflow, degree of cleaning and four internal levels).
Clicking this button opens this trend display group configuration and displays the last three days values.


