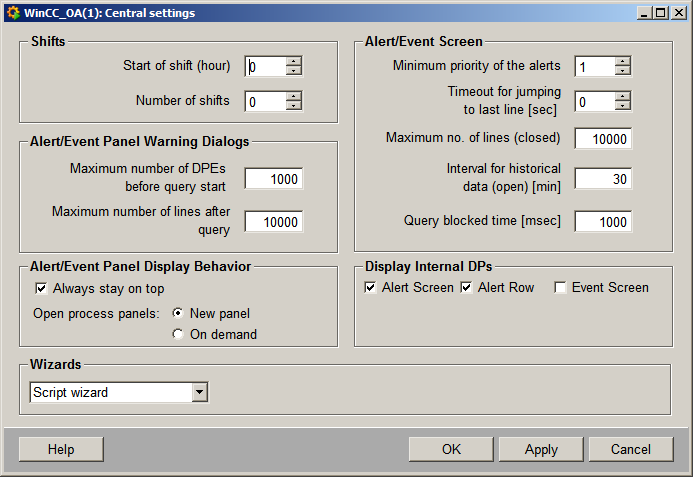
Central settings
This panel allows setting the start hour of a shift and the number of shifts and making settings for the alert and event screens. You can, for example, define the maximum number of lines that should be displayed in the alert and event screens.
Shifts
-
Start of shift (hour): Settings relating to the shift start in WinCC OA (see Laboratory values).
-
Number of shifts : Defines the number of shifts per day.
Alert/Event Panel Warning Dialogs
-
Maximum number of DPEs before query start: Maximum number of data point elements that should be queried. If the number of data points that should be queried is higher than this defined value, the query is not executed.
The alert limit "Maximum number of DPEs before query start" is ignored for the AE Screen mode "Current" (the purpose of this mode is to show all current alerts).
-
Maximum number of lines after query : Maximum number of lines that are displayed after a query. If you, for example, want to display a maximum of 10,000 lines and 20,000 lines were found, only 10,000 will be displayed. You can however also display more lines than defined but the query will take longer.
Alert/Event Panel Display Behavior
-
Always stay on top: Specifies whether the alert/event panel should always stay in the foreground or another panel (if another panel is opened).
-
Open process panels: Specifies how process panels shall be opened by clicking on the > column. If you select "New panel", the process panel will be opened as childpanel. If you select "On demand" and left-click on the > column, the context menu will be opened and you can choose via the "Processpanels" entry whether the process panel shall be opened as childpanel or in the appropriate module (this is only working if there exists a panel topology).
Alert/Event Screen
-
Minimum priority of the alerts: Only alerts with at least same priority as defined here, are displayed in the alert /event panel. This applies to the alert and event screen as well to the alert row. The minimum priority defined here has a higher priority than the priority defined in the Filter tab in the Properties of the alert table.
-
Maximum no. of lines (closed) : Number of lines to be displayed (closed) in the alert/event panel (default is 10,000).
-
Interval for historical data (open) [min]: The data for the past 30 minutes (default value) time periodis shown. This value for the interval can be specified.
-
Query blocked time [msec]:Query blocked time corresponds to the parameter "delay" of the dpQueryConnectAll() function. You can specify a time to block the work function call of dpQueryConnectAll. This means that a work function (in the dpQueryConnectAll) is not called immediately when values change but the open queries are passed immediately to the work function after the blocked time (if you, for example, acknowledge alerts, they are acknowledged only after the set time). You can define the parameter dynamically. The blocked time is useful when there are many hotlinks with few data. In this case, it is useful to set the time because the value 0 requires more performance. Small values may have a negative effect on the performance (depending on the load). When you specify a bigger value, the response time (for the queries) is of course longer.
-
Timeout for jumping to last line [sec]- if this timeout is set to 0 seconds, the view in the alert/event screen jumps immediately to the last line in the table, where the newest alert/event is shown, as soon as a new alert/event was triggered. To delay this jump a timeout in seconds can be set. This causes that the jump to the last line is taken place after this timeout. If in one of the tables the view is scrolled using the scroll bar and the left mouse button is continued to be pressed, this timeout will not start until the mouse button will not be released. This means, when an alert/event is triggered while scrolling with pressed left mouse button, the jump to the last line is not taken place as long as the mouse button will not be released and accordingly the timeout has expired.
Display Internal DPs
-
Alert panel: Displays alerts of internal data points in the alert panel.
-
Alert row: Displays alerts of internal data points in the alert row.
-
Event panel: Displays alerts of internal data points in the event panel.
Note that the DPE ShowInternals remains for downward compatibility reasons. The element cannot, however, be used directly via the user interface.
These settings are saved in the internal data point _Config (see Internal data points). The values shown in the figure "Central settings" above are default values and you can define any value. If these settings however are exceeded, the query takes longer.
An error message is displayed if more than 32737 lines are defined.
Wizards
This combo box defines which wizard is opened by clicking on the push button "Open
Property Wizard"  in the Property Editor. The following options are available:


