"curveMarking", "curveMarkingX"
By using the attribute "curveMarking" range of values or a single value can be displayed highlighted. The attribute "curveMarkingX" is used for the XY trend curve of the X part.
Synopsis
setValue(string shape, "curveMarking", string curve, int id, float min, float
                max, string color, string lineType);
getValue(string shape, "curveMarking", string curve, int id, float min, float
                max, string color, string lineType);
shape.curveMarking(string curve, int id, float min, float max, string color,
                string lineType);
Parameters
| Parameter | Description |
|---|---|
| shape | Name of the object |
| curve | Name of a curve |
| id | Area ID |
| min | Minimum value. If the minimum value == maximum value, a single line with the specified lineType is shown. Otherwise, the whole range between min and max is shown highlighted (whereas the lineType is ignored). |
| max | Maximum value. If the minimum value == maximum value, a single line with the specified lineType is shown. Otherwise, the whole range between min and max is shown highlighted (whereas the lineType is ignored). |
| color | Color of the line |
| lineType | Line type of a curve. You can find the desired line type using function lineSelector(). |
Description
By using the attribute "curveMarking", a range of values or a single value can be shown highlighted. The attribute "curveMarkingX" is used for the XY trend curve of the X part.
 Example
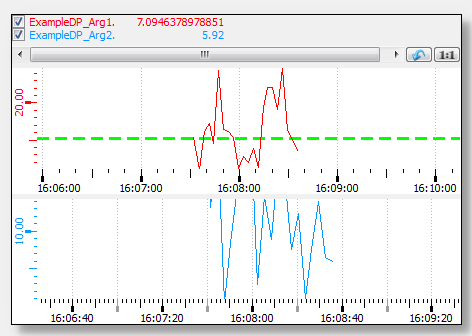
In the following example a single, dashed green line is shown.
main()
{
  TREND1.curveMarking("Curve1",1,10.5,10.5,"green","[dashed,oneColor,JoinMiter,CapButt,3]");
}
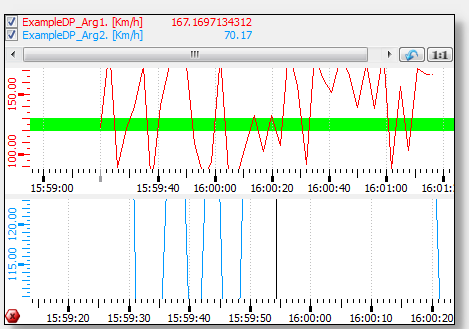
In the following example the range between 120 and 130 is shown.
main()
{
  TREND1.curveMarking("#1_1",1,120,130,"green", "[dashed,oneColor,JoinMiter,CapButt,3]");
}
Assignment
Trend