System overview in single systems
Open the system overview panel via the System management panel.
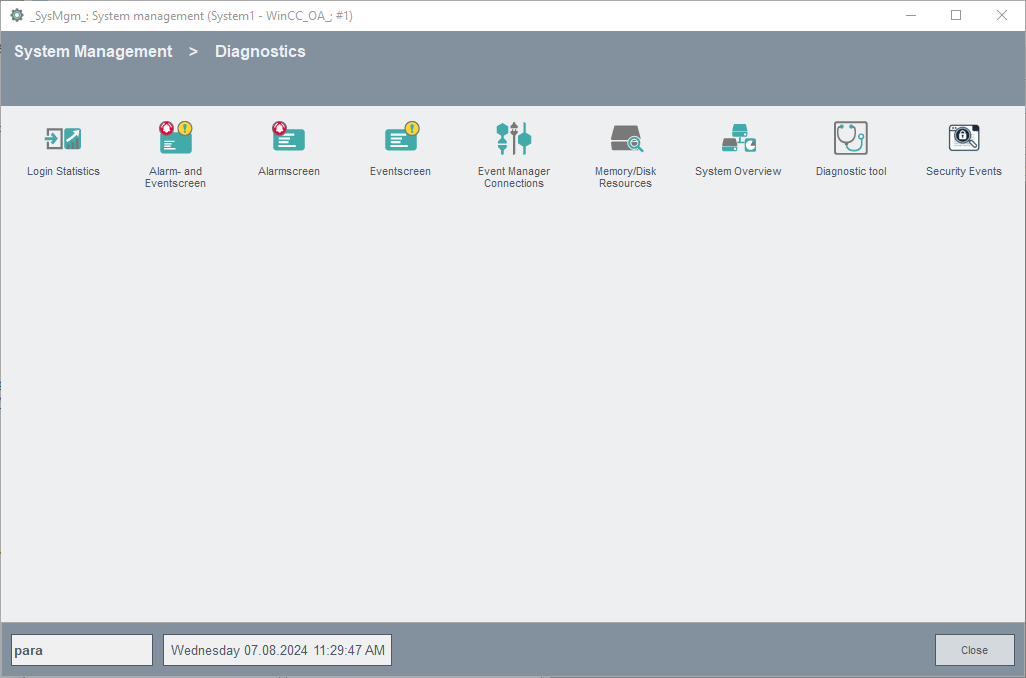
The system overview panel is opened via click on the System overview button on the Diagnostics tab:

Description of the panel
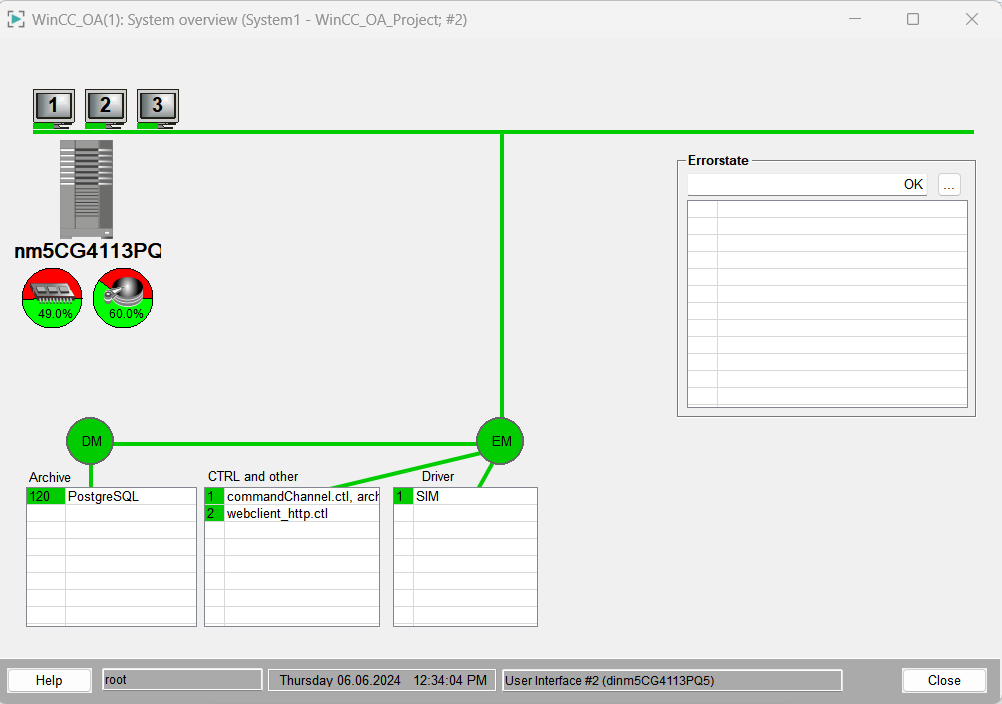
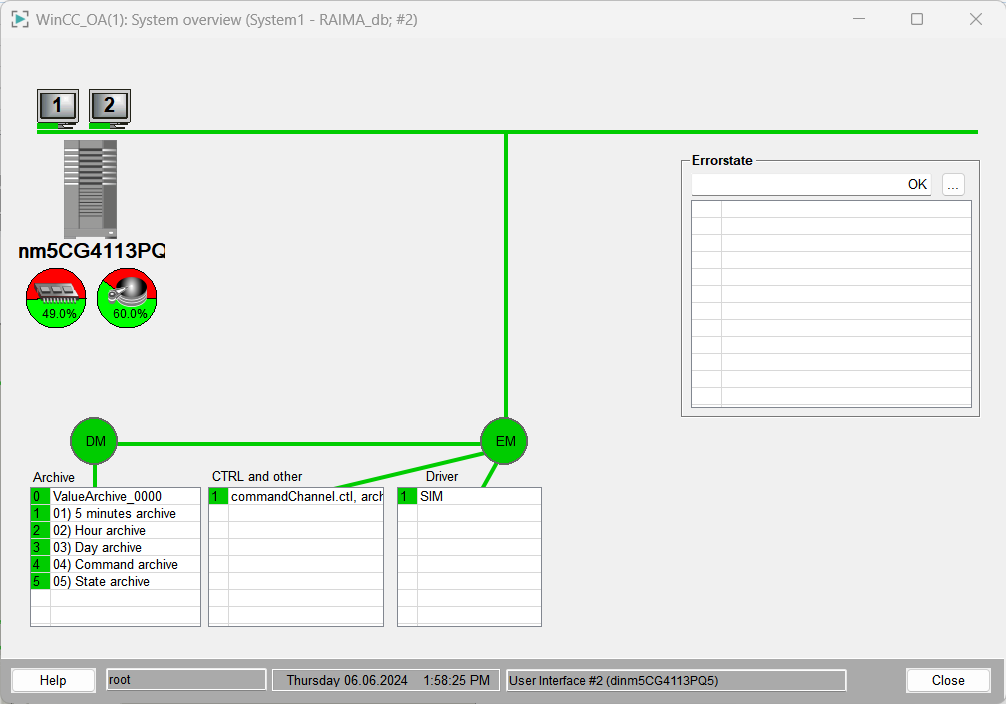
On the left of the panel you see the host name the WinCC OA project is running on, below the server symbol. The "pie symbols" below the computer symbol show the free disk space and RAM memory on the system. An information and configuration panel for monitoring the hard disk/memory (see also Monitoring the hard disk and Monitoring virtual memory) is opened via left mouse click.
In the lower part of this panel the Data and Event managers (DM and EM) are shown as well as their connection to all registered managers (e.g. CTRL, archive, drivers). The tables below the DM or EM contain detailed information on the registered managers.
If the system is in emergency mode this is visualized via the circle symbol of the DM with a red triangle containing an exclamation point (for more information on the emergency mode see chapter Data manager emergency mode, basics).
Further information and configuration pop-ups can be opened via the
Archive as well as Control and
other tables. Via left mouse click on an archive the action window
for the specific archive is opened. The action window allows to swap out and back up
archives (see also Swap out/backup
archives). A left mouse click on the running CTRL Manager shows an
information panel with the CTRL scripts contained in the
pvss_scripts.lst file.
The status bar in the lowest part of the system overview panel displays the current user, date, time as well as details on the user interface the panel was opened with. In the figure above the details on the UI show the following line:
Windows User Interface #1 (EIWRK115)
- #1 is the number of the UI.
- (EIWRK115) corresponds to the display the UI is running on.
The standard buttons Close and Online Help are located on the right next to the status bar.
Configuration of the error weighting
The Error state table on the right side of this panel shows the error state on the computer.
Single system components can be controlled and provided with a
weighting in a system. The weighting is used for the calculation of the error status
in case of errors. Components that are controlled and for which the error status is
calculated are e.g. managers, TCP connections, PLC connections, hard disk capacity,
RAM memory etc. The weighting is a number between 0 and 999 and the user can assign
it specific to the components. How grave the error is and which number should be set
for the weighting is defined by the user. The loss of a PLC connection is e.g.
configured with a higher weighting than the failure of a UI. The error calculation
is executed in the CTRL script calculateState.ctl (this script is
included in the pvss_scripts list).
There is a panel for the configuration of the weighting. The panel is opened via click on the Configure weight entry in the context menu. (Context menu is opened via right mouse click on the Error state table). This context menu can also be opened via right mouse click on any table, button or symbol on the system overview panel as well as by clicking the ... button above the Error state table.
The configuration panel consists of the Manager and Data points tabs. The weighting of single managers and weighting of arbitrary information on data points is executed on these tabs.
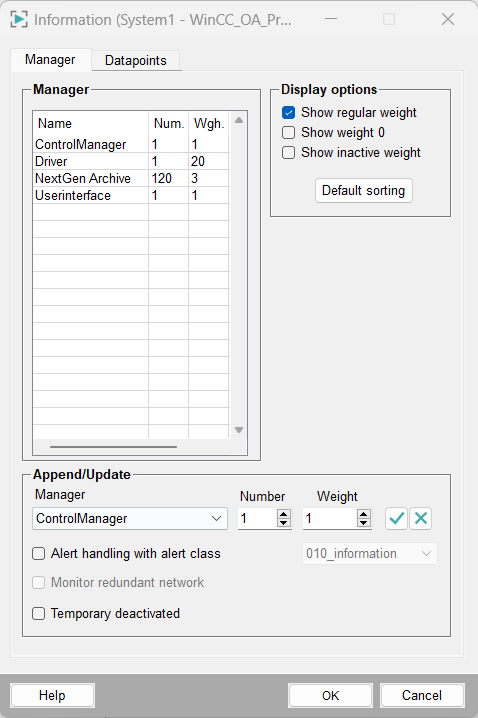
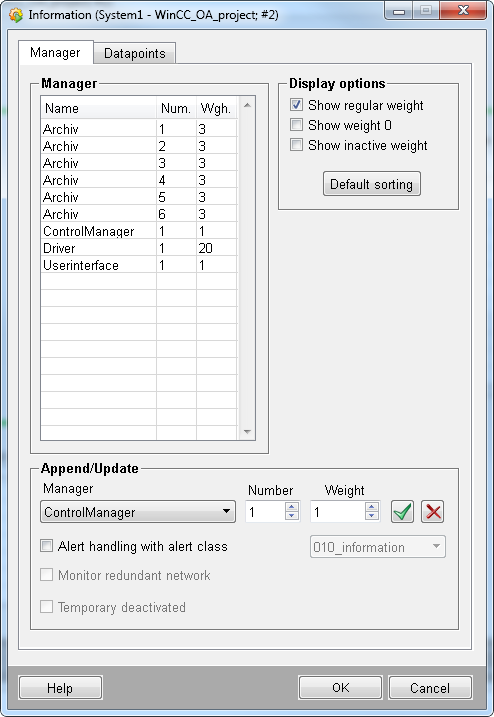
Manager tab
The weighting for single managers in a WinCC OA system is configured on this tab. The weighting is already configured for selected managers (Archives, Control managers, drivers, user interfaces) by default. The configured weightings are shown in the Manager table. You can change the settings of a predefined manager by choosing it or add a new manager with the desired settings to the table. In case of errors e.g. manager cannot be started or terminates, the configured weighting is included in the calculation of the error status. Following settings can be set in the lower part of this panel (Append/Update):
- Manager: Choose the manager, which should be added to the table and used for the error calculation, from this combo box.
| Manager name in the WinCC OA console | Manager category in the error weighting |
|---|---|
| User Interface - WCCOAui | Userinterface |
| Control Manager - WCCOActrl | ControlManager |
|
Simulation driver - WCCILsim BACNet Driver - WCCOAbacnet, CERBERUS Driver - WCCOAcerb, DNP3 Driver - WCCOAdnp3, EIP Driver - WCCOAEip, IEC 60870 101/104 Driver - WCCOAiec, IEC 61850/61400 Client - WCCOAiec61850, Modbus Driver - WCCOAmod, OPC DA Client - WCCOAopc, OPC UA Client - WCCOAopcua, RK512 Driver - WCCOArk512, S7 Driver - WCCOAs7, SBUS Driver - WCCOAsbus, Sinaut Driver - WCCOAsinaut, SNMP Manager - WCCOAsnmp, SSI Driver - WCCOAssi MQTT Client - WCCOAmqtt |
Driver |
|
NextGen Archive - WCCOAnextgenarch Archive Manager - WCCOAvalarch RDB Archiv Manager - WCCOArdb Value Archive |
Archiv |
| Either the name of the apiManager executable or the name that you specify in the managers.cat file under wincc_oa_path/msg/[language]/ | ApiManager |
| ASCII Manager | AsciiManager |
|
Modbus TCP Server - WCCOAmodsrv, OPC AE Client - WCCOAopcAE, OPC AE Server - WCCOAopcsrvAE, OPC DA Server - WCCOAopcsrv, OPC HDA Client - WCCOAopchda, OPC HDA Server - WCCOAopchdasrv, OPC UA Server - WCCOAopcuasrv, SNMP LiveAgent - WCCOAsnmpa, TLS Gateway - WCCOAtlsgw Reporting Manager - WCCOAreporting |
DeviceManager |
| Distribution Manager - WCCILdist | DistManager |
| Redundancy Manager - WCCILredu | RedundancyManager |
| OLE DB-Provider - WCCOAoledb | _Conn_data_0_1_to_report_1 |
- Number: Assign a specific manager number via this spin button. If several UIs were started with different numbers the number of the desired UI manager that should be monitored has to be set here. Note that the first number that can be assigned here is 1 whereas the first number in the WinCC_OA console is 0.
- Weight: Assign a number to the weighting via this spin button (0-999 possible). You have to decide how grave the error of a specific manager is. This means which number is set for the weighting.
- Alert handling with alert class: If the error should not only be shown in the system overview panel, activate this check box and choose an alarm class from the combo box (default is "060_alert"). An alert is shown in the alert panel in case of errors. By activating this check box an alert handling is created (with selected alert class) on an internal data point of type _ManagerConnections. If an alert handling with an alert class is e.g. configured for the operator station number 1 an alert handling is added to the data point _Conn_event_0_1_to_ui_1_1.Link0 (the data point is automatically created when adding it to the table of the monitored managers). This data point contains an additional boolean element with the name Link1 in case that this UI is provided with a redundant network connection and this connection is monitored. The network is monitored via the check box Monitor redundant network. When creating a DP of type _ManagerConnections the current status is not written on the DP elements. First after change of the connection status the information is set on the data point elements.
- Temporary deactivated: By activating this check box the set weighting of the manager is not included in the calculation of the error status. If e.g. a periphery device/PLC has failed and has to be fixed the monitoring of the driver (the connection to the specific periphery) can be temporary deactivated in order to not face the known errors in the system overview panel.
There are options for setting filter criteria for the sorting of the managers shown in the table. The options are located next to the table at the top of the panel on the right side:
- Show regular weight: Shows all configured managers with their weighting.
- Show weight 0: Shows managers with the weighting 0.
- Show inactive weight: (Shows all managers whose weighting was temporary deactivated. This means that these are not included in the calculation of the error status.
- Default sorting: Via this button the set default sorting of the table is restored (Default = sort by the column "Manager").
Add a manager with a weighting
Set your settings as shown in the figure (Manager tab) above.
- Choose a user interface from the Manager combo box.
- Assign the number 5 via the Number spin button.
- Assign the weighting 10 to the UI with the number 5.
- Configure an alert handling with an alert class in order to display an alert in the alert panel in case of errors.
- Activate the check box Monitor redundant network. In this example the UI with the number 5 is run with a redundant network connection to the system.
- After creating the settings click on the corresponding buttons for applying the settings in the table. Selected entries in the table can also be deleted (see Default buttons on configuration panels).
If a UI or CTRL manager is included in the table and an internal data point of this type does not exist, the data point is automatically created (for UI: _Ui_*, for CTRL: _CtrlDebug_CTRL_*; see also Internal data point types for detailed information on these types).
Data points tab
The weighting for single data point elements in a WinCC OA system is configured on this tab. By default weightings are already configured for data points that act as an indicator for too little disk space or for too little virtual memory (see also Triggering the emergency mode). The configured weightings are shown in the table Data point limit check. You can change the settings of a predefined data point by choosing it or add a new data point with the desired settings to the table. In case of errors e.g. hard disk full or connection of a driver to the periphery failed (is also mapped on internal DPs), the configured weighting is included in the calculation of the error status.
The functionality of this tab is very similar to the functionality of the Manager tab. Following settings can be set in the lower part of this panel (Append/Update DPE):
- Predefined elements can be chosen from the combo box for the connection state of some drivers (connection to the periphery).
- Other data point elements can be chosen via the data point selector next to the combo box.
- There is a combo box and a text field for selecting a relational operator as well as for selecting a limit for the chosen data point element, below the combo box used for selecting DPEs.
- Weight : Assign a number to the weighting (0-999) with this spin button. How grave the error is (error of exceeding the limit or how much the value falls below the limit on the DPE) and which number should be set for the weighting is defined by the user.
Example: How to add a data point with a weighting
Create your settings like shown in the figure above (Data points tab).
- Choose the _Mod_Plc_1.ConnState data point element from the combo box (the connection status of the Modbus driver to the PLC with the number 1 is shown on this DPE).
- Set the relational operator "==" and the limit "0". This means that if this DPE is set to 0 the configured weighting is included in the error calculation.
- Assign the weighting 120 to this data point element.
- After creating the desired settings click on the corresponding buttons for applying the settings in the table. Selected entries in the table can also be deleted (see also Default buttons on configuration panels).
After executing the steps of both examples (adding a manager with a weighting and adding a data point with a weighting) and an error occurs (UI with the number 5 terminates and the connection to PLC 1 with the Modbus driver is lost) the table Error state in the system overview panel is seen in the figure below.
All error statuses/weightings are summed and shown at the top (130/350 - 130 is the sum of the weightings for all upcoming errors and 350 is the sum of all configured weightings). In the table below you see the single errors on the specific computer with the set weighting.
Information and settings of the UIs
The UIs are shown at the top. The monitor symbols display the total number of connected UIs in the system (the green bar below the monitor symbols shows the connection status to the Event manager). Also UIs that were already connected and do not run at the moment are shown (in this case the bars will be red).
Different settings and configurations can be executed for the UIs. A panel including general information like Start time, User, Display (computer name on which the UI is running ), IP address of the computer for the chosen user interface and in the lower area the host name (where the Event Manager is running) resp. the connection (Link) to the Event Manager (this information is read only), is opened via left mouse click on a monitor symbol.
The green box next to Link 0 shows the connection of the UI to the Event Manager. The meaning of a yellow box is that there is an alert handling configured at the internal data point of the UI.
The Refresh button can be used to update the status. The time of last refresh is shown in the panel.
A context menu, which allows to create settings concerning the UI, is opened via right mouse click on a monitor symbol:
The status of the UI (run/stopped) is shown as the first entry, that is grayed out, in the context menu. The entry Send standard "PING" opens a terminal window and sends a standard PING command to the computer, the UI is running on. With this entry the network connection to the computer can be checked (e.g. the connection to a specific computer can be checked when the opening of panels takes long).
Send message opens a another panel, which allows to send a message to the particular UI (this makes sense if you have to make maintenance works and want to inform other users at the control stations).
The entry Statistics opens a panel, which shows the message and DP statistics for the connection of the Event manager with the UI (see also Diagnostics panels). This panel is also opened via left mouse click on the Event and Data managers in the system overview panel (there is a further entry Msg statistic to <host2> available in this context menu in a redundant system. Via this entry the message and DP statistics panel for the connection of the Event manager on the redundant computer is opened with the UI).
The selected user interface is stopped via Terminate Ui #2 (before the UI is deactivated you have to confirm that you want to close the UI).
By selecting the last entry Configure weight the error weighting can be configured (see also Configuration of the error weighting at the top of this page).
If a redundant system is in the split mode there are two additional entries visible in this panel. Via this entries you can switch the UI to Host1 or to Host2 (first redundancy partner or second redundancy partner). The UI always sends to both events. The UI is only switched in the receiving direction (see chapter Redundancy in split mode of the redundancy documentation for more information).


