Audit Trail panel
Since it has to be possible to access historical data and view detailed information
regarding the activities performed by different users the Audit trail panel allows the
user administration to track important changes (e.g. set points, parameters etc.). The
Audit Trail-Panel "audit_screen.pnl" is located in wincc_oa_path\panels\vision. The information provided by the
AuditTrail panel is precise and you can see who made changes, when they were made and
what values were changed. This enhances WinCC OA security and helps
you to ensure the reliability of the users. The information cannot be tracked
automatically by using the Audit trail panel, e.g. PARA and STD_symbols do not write
into the Audit trail. In order to track the information you have to call the two
functions writeAuditEntry and writeAuditBatchEntry in
your own panels.
The first time you open the audit trail panel you can choose a new archive and configure it or assign an old archive. The audit trail data is stored in this archive for a reasonable long time. See chapter History DB for more information on archives. The following window allows to choose an archive from the combo box.

After choosing the archive from the combo box, start the value archiving in the WinCC OA console:
WCCOAvalarch -num 6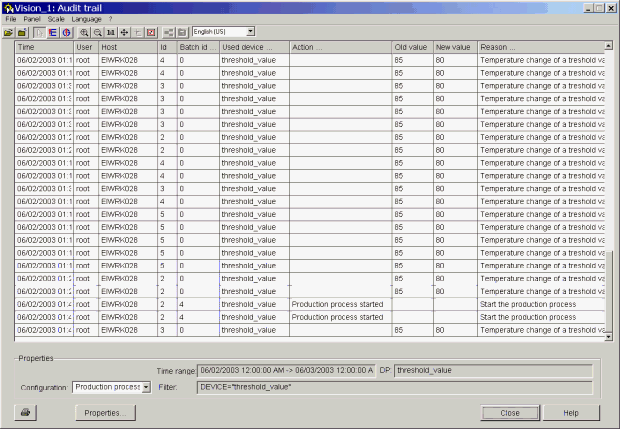
When you open the Audit Trail panel (shown in the figure above) the properties panel is opened simultaneously. The opened panel always contains the current settings. The properties panel is described later in this chapter.
The Audit trail panel provides information listed below. The data can be filtered into the panel by using different filter criteria like a user name, device (device means the data point name) and screen (the computer that was used to perform the action). The Filter tab, which allows to define the criteria, is described in detail later in this chapter.
Time : The exact time when an action was executed.
User : The user who executed the action.
Host : The host that was used to execute the action.
Id : The user ID.
Batch id : The batch number.
Used Device : Shows the device (data point) the action had an influence on.
Action : What kind of action was executed e.g. production process started or stopped.
Old value : The old value.
New value : The new changed value.
Reason : Reason why the value was changed by the user.
Note that the action column and the value columns do not contain values at the same time because the action column is meant for actions like executing scripts and setting recipes. In these cases several new and old values can be set and only the name of the executed action (instead of all values) is written into the audit Trail panel. The old and new value columns are meant for set point values and contain the exact values. The function writeAuditEntry is used to write the values and the function writeAuditBatchEntry is used to write actions like "production process started" into the Audit trail panel.
The Properties allow you to:
Choose a configuration from the Configuration combo box. A configuration means that you have defined a time range during which you want to get the executed actions, the old and new values etc. (see list above ) and you have defined filter criteria or not. If you define filter criteria the information is filtered according to the criteria (if you e.g. define the user name "mdavis" only the actions performed by the user "mdavis" are searched.) A new configuration can be saved via the Properties_Audit trail window shown in the figure below.
it is also possible to print the table content via the print button ![]() and
and
set different filter options via the Properties... button. In the main panel you can additionally see the Time range (within the actions are tracked), name of the DP that was changed (the value of the DP was changed) and the used Filter criteria (user, device and screen).
The Properties... button opens the Properties_Audit trail window shown in the following figure:
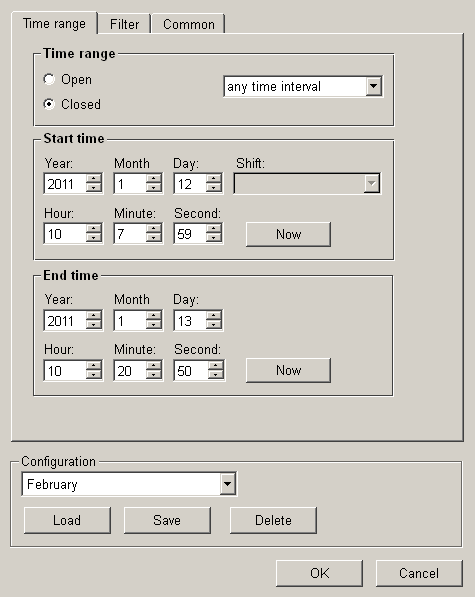
The window includes three different tabs:
-
Time range
-
Filterand
-
Common
In the Time range tab you can set the time range within the actions should be tracked.
Time range :
Open : The open option allows you to set the time yourself in the start and end time fields.
Closed : Allows to choose a time range from the combo box:
You can choose eight different time options.
Start time / End time :
Start time allows to define a date as well as a start and end time. The date and time can, however, only be defined if you choose the option any time interval. If you choose the optionany dayyou can define a desired day when you want the actions to be tracked. All other options contain predefined date and time settings.
Shift : Shows the shift "Whole day" if you select the option today, yesterday or any day. All shifts in case of shift work are tracked.
![]() Selects the current time.
Selects the current time.
The following combo box and the buttons are available in all three (Time range, Filter and Common) tabs:
Configuration : Choose an existing configuration or create a new one by setting the desired date and time and by typing the name for the configuration into the combo box.
![]() Loads the configuration chosen from
the combo box.
Loads the configuration chosen from
the combo box.
![]() Saves the current configuration.
Saves the current configuration.
![]() Deletes the current
configuration.
Deletes the current
configuration.
![]() Applies the settings and closes the
panel.
Applies the settings and closes the
panel.
![]() Closes the panel without applying
the settings.
Closes the panel without applying
the settings.
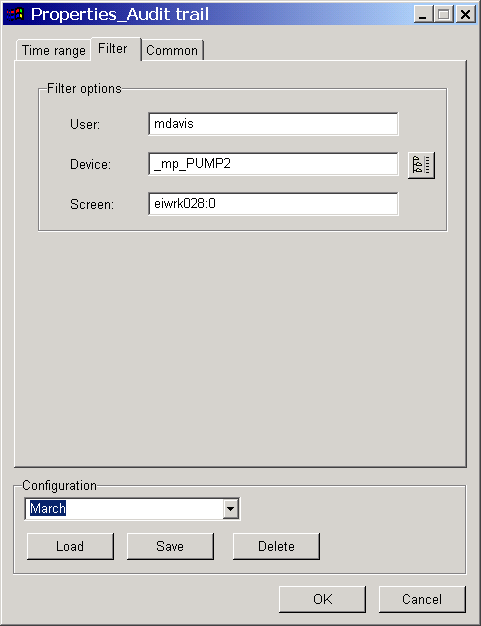
Filter tab shown in the figure below allows to set the following filter options:
User : The user name
Device: Choose a data point and track the value changes of this data point
Screen : The screen (the computer name) that was used to change the value
Note that you can use wild cards * as filter criteria (e.g. r* filters all users beginning with the letter 'r').
Common tab allows defining a name for the printout header.
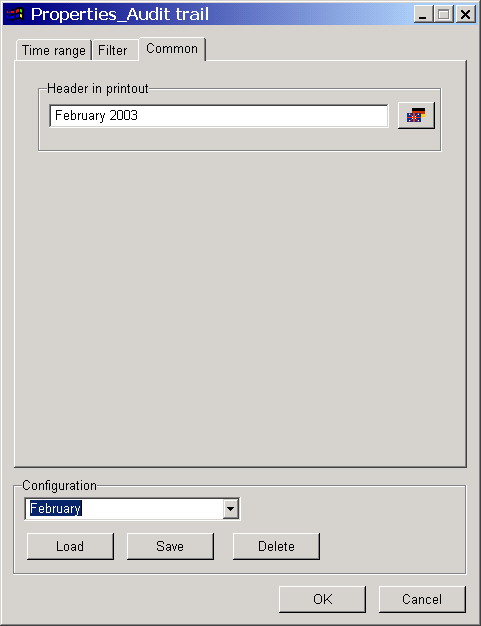
![]() Define the name for the printout
header.
Define the name for the printout
header.
