System overview in redundant systems
Open the system overview panel via the System management panel.
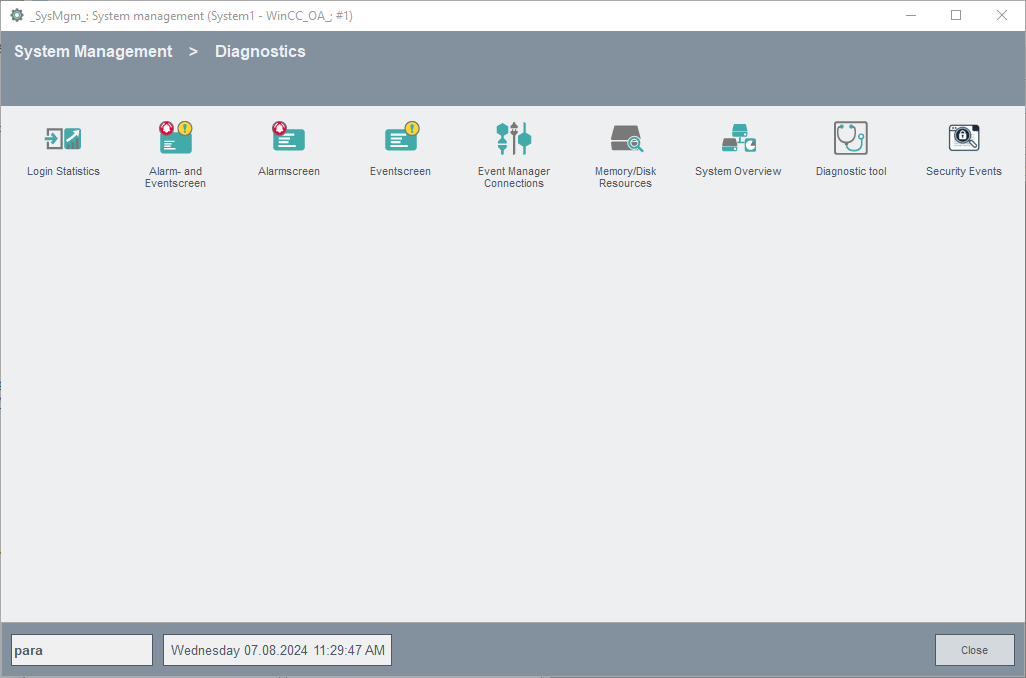
The system overview panel is opened via click on the System overview button on the Diagnostics tab:
Description of the panel
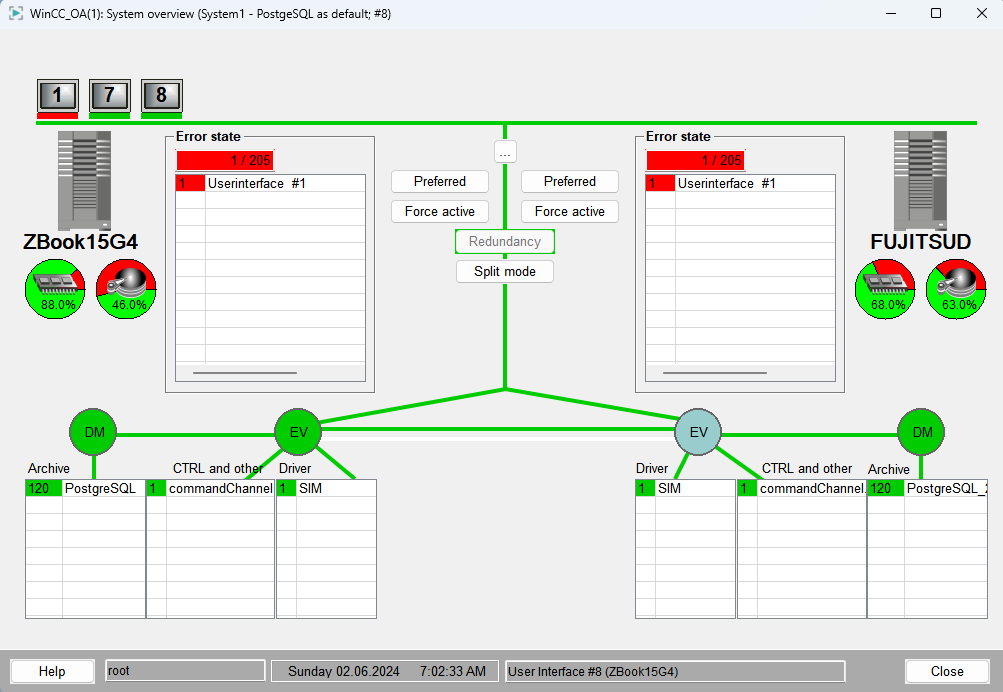
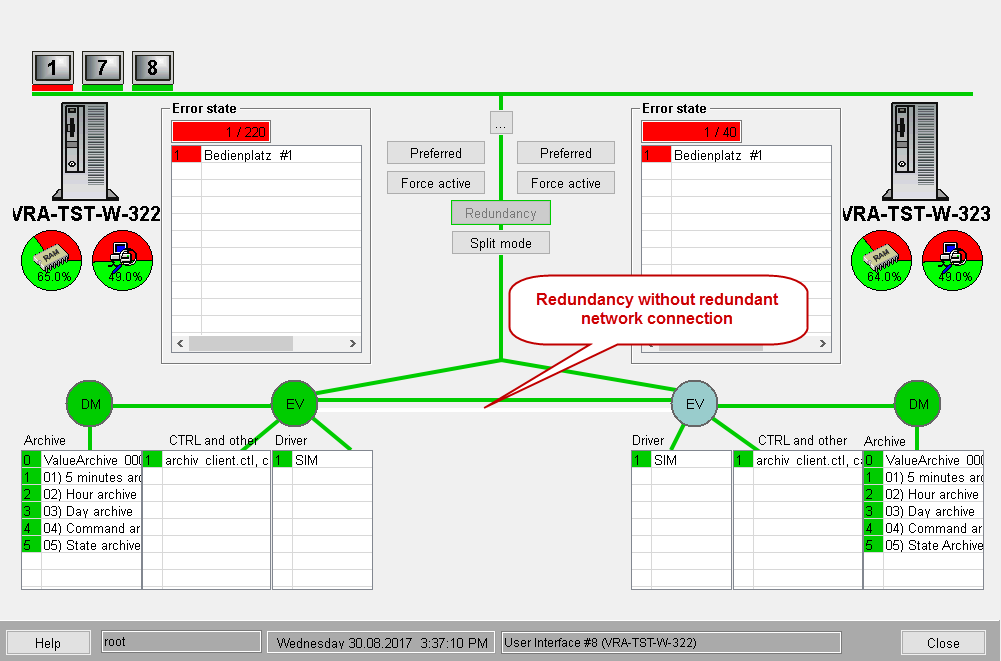
The structure and the functionality of the system overview panel is basically the same like the system overview panel in a single system (see also System overview in single systems). On the left and right side of the panel you see the redundant computers (the host names) below the server symbols. Both Event Managers are connected to each other via a redundant network connection (the two green lines between the both events display the connection. If a white line is shown, the connection is broken). The active Event Manager is indicated by a green background color.
The status bar in the lowest part of the system overview panel displays the current user, date, time as well as details on the user interface the panel was opened with. In the figure above the details on the UI show the following line:
Windows User Interface #1 (EIWRK115)
- #1 is the number of the UI
- (EIWRK115) corresponds to the display the UI is running on.
In the split mode additionally the computer on which the UI was current switched, is shown e.g.:
Windows User Interface #1 (EIWRK115) - eiwrk115
See chapter Redundancy in split mode of the redundancy documentation for further information on the split mode.
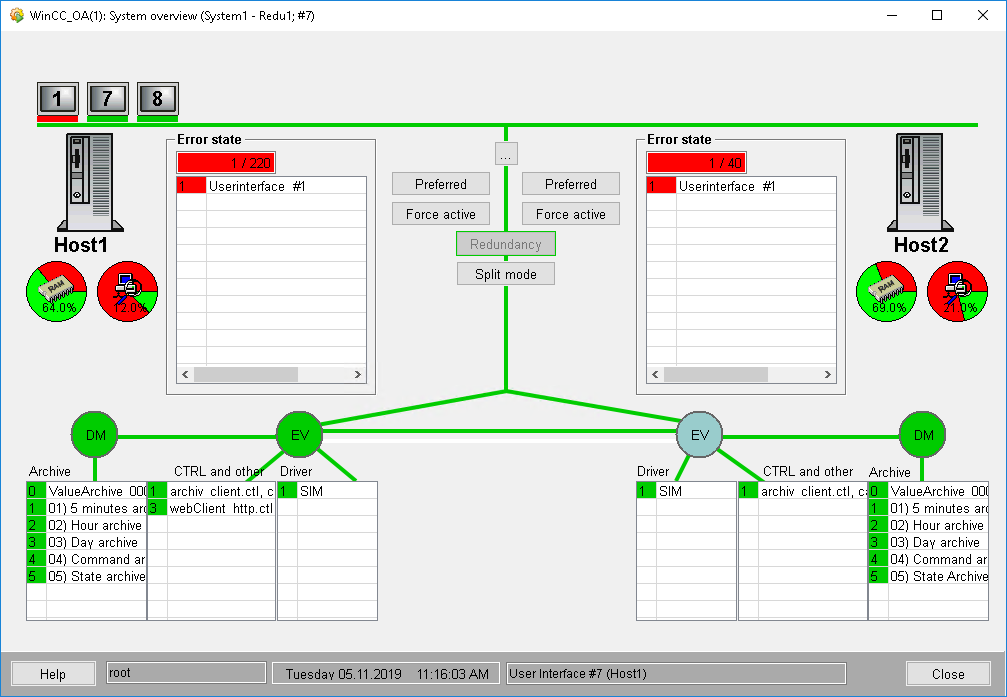
The buttons Preferred, Force active, Redundancy and Split mode are located in the middle of the panel. These buttons in the system overview panel are available for setting the active/passive status manually for the specific computer:
- Preferred: If the button is pressed on the passive computer the computer is switched and the computer that was passive before becomes active and the active computer becomes passive. The computer that has the preferred setting is the active computer. The preferred computer can be switched only when both computers have the same error status. If you click the preferred button twice, the preferred setting is deleted and the active server remains active in case of same error state.
- Force active: The active computer can be switched (contrary to the preferred option) also when the computer that should become active have a higher error status. Thus, The computer , which becomes active by clicking the Force active button, assumes the control. The active system is shown via the "pressed" and orange colored buttonForce active. The preferred computer cannot be switched in this mode anymore (both preferred buttons are grayed out). Click the Force active button again to quit the control mode.
- Redundancy : Via this button you can switch to the redundancy mode if the split mode is active.
- Split mode : Via this button you can switch to split mode.
If the file synchronization between the systems is activated, additionally the "FileSync" button is present. This opens the panel for configuration of the file synchronization (see File synchronization).
See chapter Failure behavior and switching criteria of the redundancy documentation for details on the switching processes.
Configuration of the error weighting
Open the panel for the configuration of the error weighting once and click on OK so that the error state is shown correctly.
The both Error state tables on the left and right side of the system overview panel show the error status in a redundant system. For the configuration of the error weighting with the available panels see chapter System overview in single systems. The settings of a redundant system are not different than the settings of a single system. The panels for the configuration of the error weighting are opened via click on the ... button or via the available context menu with the Configure weight entry. The weighting parameter is primarily intended for manager connections to the EVENT.
In a redundant system the check box Monitor redundant network may not be activated for local UIs. UIs running local on the server do not build two connections to the Event Manager and thus an alert would be triggered for the nonexisting second connection when the monitoring for a local UI is activated.
When configuring a weighting for a redundant DP (e.g. _Mod_Plc_1.ConnState) this weighting is also set on the second DP (meaning _Mod_Plc_1_2.ConnState). Thus, the weighting for redundant DPs only has to be configured once. In the table of the data points that were set for the weighting only the data point for the left computer is visible (DP without postfix "_2"). For more information on the redundant data points see chapter Principle and functionality of the redundancy documentation.
calculateState and Debug Flag "calcstate"
Use the debug flag "calcstate" to log status changes. This means changes in the manager state. Also the new calculated error state and the missing (not running) monitored managers are logged. Use the debug flag for the CTRL manager that starts the calculateState.ctl script. The changes are also written to the internal data point element _ReduManager(_2).ErrorChangeReason.
The debug flag (-dbg calcstate) specifies that the messages are shown in the log viewer. The messages are always written to the data point element _ReduManager(_2).ErrorChangeReason.
For configuring the weighting of redundant DPs both DPs (with and without "_2") have to exist. Thus, assure that both data points are created in the system before configuring the error weighting!
Information and settings of the UIs
The UIs are shown at the top. The monitor symbols display the total number of connected UIs in the system (the green bar below the monitor symbols shows the connection status to the Event manager. In a redundant system there are two green bars that visualize the connection to the left or right computer). Also UIs that were already connected and do not run at the moment are shown (in this case the bars will be red). In a redundant system with Redundant network connections, the network connection is shown at the bottom of the panel - see figure below.
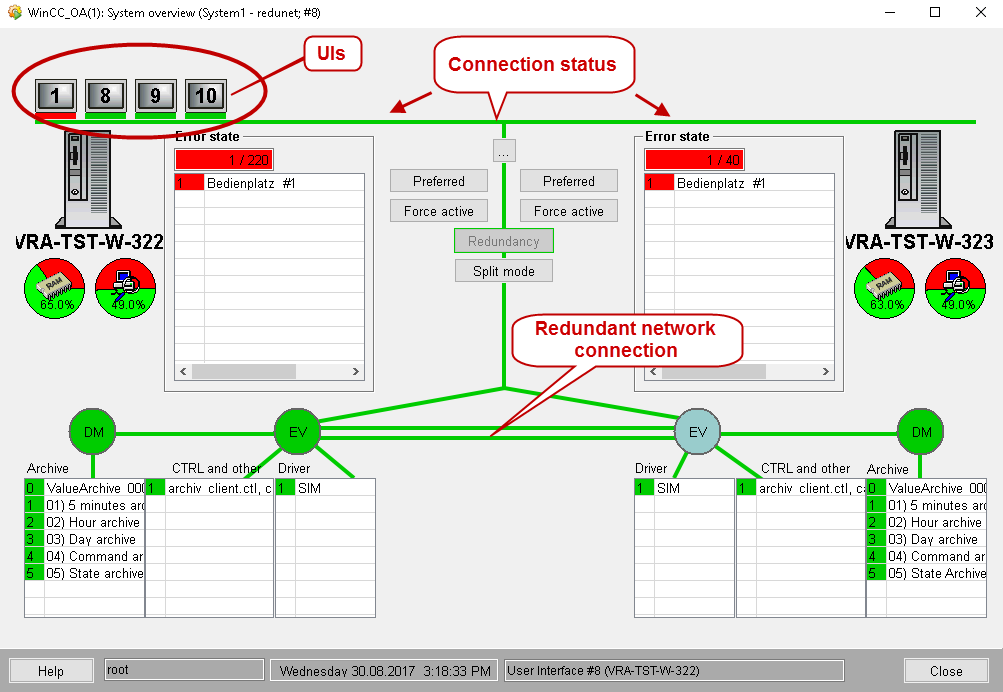
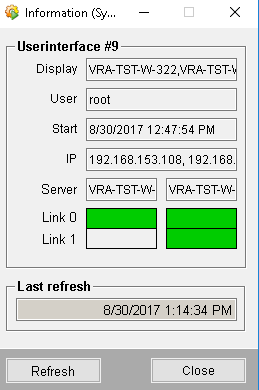
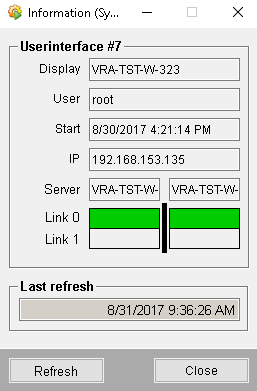
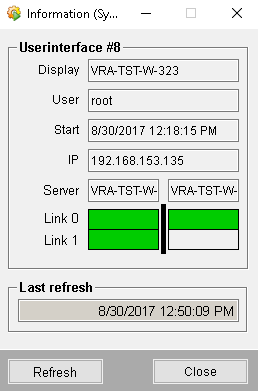
A panel including general information like Start time, User, Display (computer name on which the UI is running ), IP address of the computer for the chosen user interface and in the lower area the host name (where the Event Manager is running) resp. the connection (Link) to the Event Manager (this information is read only), is opened via left mouse click on a monitor symbol.
The yellow box specifies that there is an alert handling configured for the internal data point of the UI. In the following figure, an alert handling was configured for the internal data point of the Userinterface #8 (_Ui_8)
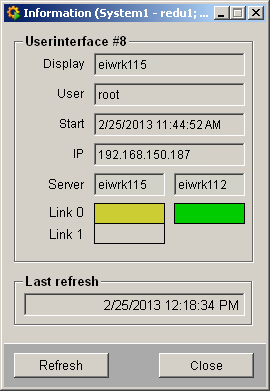
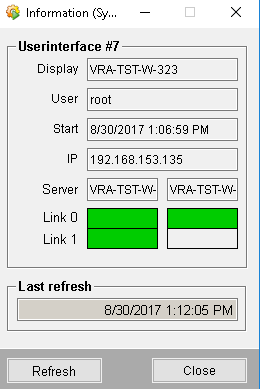
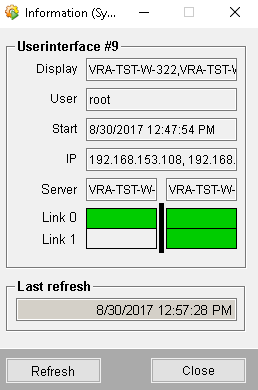
In a redundant system you can see a second box next to the entries Server, Link 0 and Link 1. These boxes present the connection of the UI to the Event Manager of the second redundancy partner. If the connection of the UI to the Event Manager is additionally configured with a redundant network connection another box is shown next to Link 1. (This means that altogether 4 boxes can be shown in this information panel in case of a redundant system and when redundant network connections are configured). The different options of the Information panel are shown below.
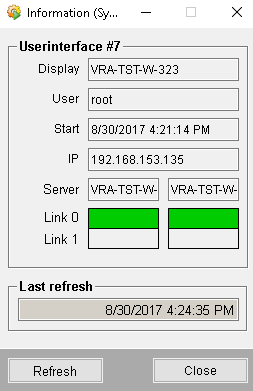
In order to display all four boxes, a data point must be created. A restart of the system is also necessary. See figure below.

In order to avoid problems with UI manager numbers in a redundant system, numbers starting with 7 are assigned to UIs when a UI is started without the option "-num". This threshold can be changed by using the config entry lowestAutoManNumUI. Remote UIs to a redundant system have to be started with a fixed number (therefore, use the numbers 1 to 6). Use the fixed numbers also when configuring the error weighting for the remote UIs.
System overview when using Disaster Recovery System
When the Disaster Recovery System is used, then the system overview of the Disaster Recovery Systems is shown in the first tab of the system overview panel (see System Overview). Via the neighboring tabs you can switch to the system overviews of the redundant systems.


