Redundancy in split mode
In redundant systems you can switch to so called split mode. In split mode the redundant server couple is split in two single systems. One system continues to work "active", communicates with the periphery, forwards value changes, etc. The other system can be used for testing new configurations and configurations without interfering the running operation. For using the split mode the split manager must be active within your system.
After the tests with new configurations are completed the state automatically returns to normal (redundancy) on the basis of one of the both servers (keep the original configuration or establish the new configuration).
In the split mode the message logic in the message and command direction is considerably different than message logic in redundancy. This page describes in more detail the functionality and use of the split mode.
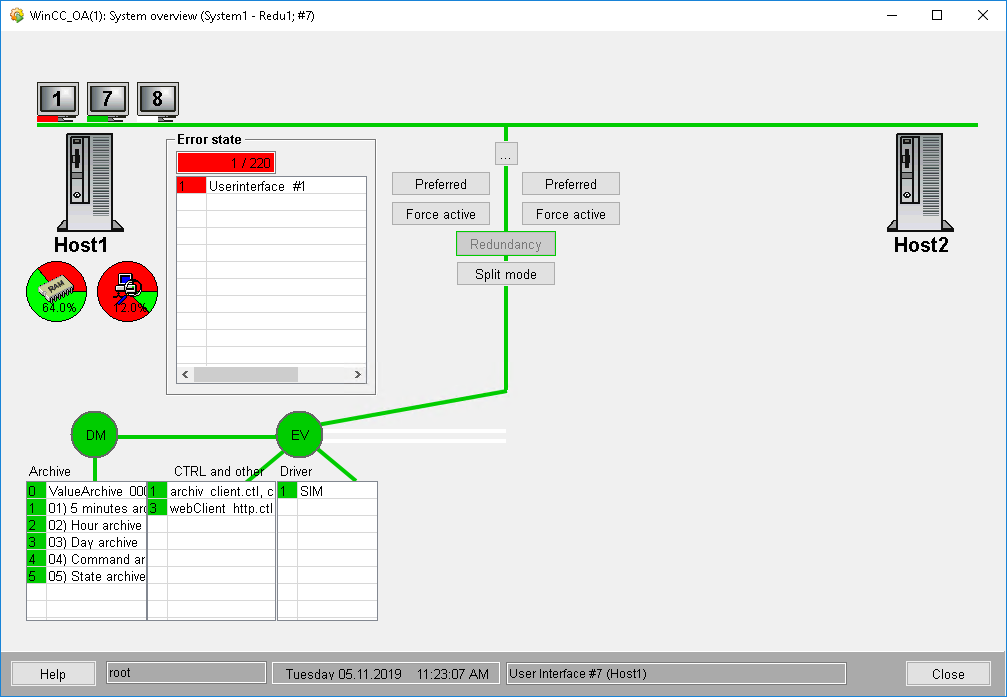
The switching to the split mode is executed via the Split mode button in the system overview panel (see also System overview panel with redundancy).
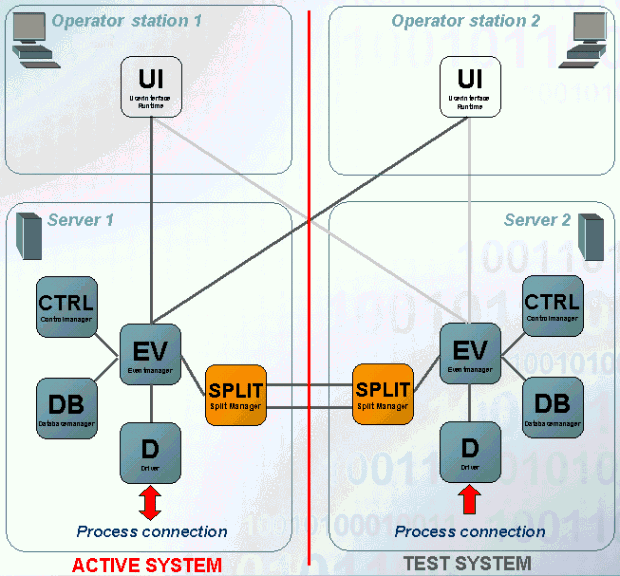
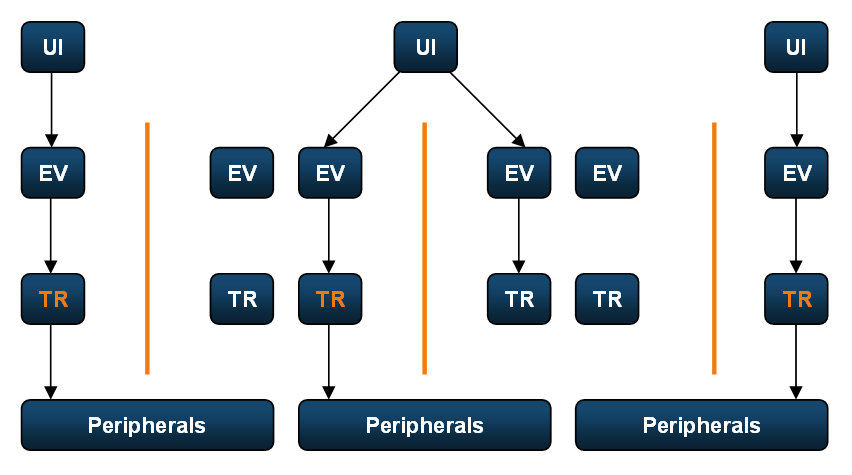
The figure shows in an easy form the functionality of the split mode. As already mentioned the redundant system is split. Via the separation an "active" and a test system are generated. The active system continues to work normally and takes care of the operating terminals. Contrary to the redundancy the Event Managers of both systems are active. The UIs are connected to both Event Managers.
The split manager is running during the split mode (the Redu manager is in stand-by mode) and exchanges data between the systems. The data for the exchange can be specified via the data point groups SplitGet[_2] and SplitConnect[_2]. SplitGet[_2] is the default name of the copyDPGroup. This group contains DPs that are copied when both split managers receive the connection. This is a one-time balancing. When the split managers connect, they execute a dpGet() on these DPs and transfer the values to the other split manager.
SplitConnect[_2] is the default name of the connectDpGroup. This group contains the DPs that are transferred in the split mode every time something changes. This means when the split managers connect they execute a dpConnect on these DPs and transfer the changes to the other split manager.
For more information on the data point groups see chapter data point groups, basics. Internal system states are exchanged between the computers by default (DPEs are contained in both DP groups that are responsible for the connection state, disk space, working memory, monitoring of the redundant network etc.). In order to exchange project specific data points between the both systems in split mode the existing DP groups have to be extended.
Different data sets on both systems, which have an essential influence on the functionality and handling in the split mode concerning the message and command direction, result from different configurations on the test system (create/delete data points).
Example: Using the split mode
- Switch the server, which should normally continue to work, active in the system overview panel (click on the Preferred button - CAUTION: can be executed only when the error status is the same on both computers)
- Switch to the split mode (click on the Split mode button in the system overview panel).
Note:When switching to split mode and switching the driver, the "active driver" button is greyed out for the local UI (on which the UI was switched) for 30 seconds.
- The driver on the system, which continues to work, remains active (Active driver button).
- Start another User Interface with the command line option "-data hostname[:port]" and "-event hostname[:port]", which connects to the test system or open the ASCII manager panel.
- Change the configuration (create/ delete data points) on the test system with the started UI. At changes with the aid of the ASCII Manager panel the right host name has to be shown at the connection information in the panel so that the changes are executed on the right computer and in the right database. Via the button Switch you can select the right computer (test system) where the changes should be executed ,in the ASCII manager panel (see also ASCII panel). Create e.g. the data point "TestDP_split of type "ExampleDP_Float".
- Test the changed configuration on the test system.
- If the changes are satisfying set the driver on the test system active in order to connect the new configuration to the periphery.
Note:In order to set the driver active on the test system the PLC has to be suited to the new configuration so that new created DPs can be used with the PLC!
- All other UIs can be used during the whole time.
- Switch again to the redundancy mode (click on the Redundancy button). As basis for the redundancy the computer with the changed configuration (=test system) is used, the other restarts and adopts the new configuration via the automatic recovery when starting.
Problems can occur when manager numbers are assigned automatically in a redundant system! This case occurs when you proceed as follows:
- A UI is started via the console (without command line options), which connects to both computers and receives a number from the Data Manager (Active as well as passive) (e.g. the number 1).
- Subsequently a UI with the options "-data hostname[:port]" and "-event hostname[:port]" is started via the console and receives a number from particular Data manager to which the connection is built (e.g. number 2).
- Another UI is started via the console (without command line options) which connects to both managers again and receives the number 3 from the Data manager on the first computer (since number 1 and 2 of this Data manager are already assigned), the number 2 from the Data manager of the second computer (since this Data manager has only assigned the number 1 so far).
In this case the third UI is terminated with an error message. In order to prevent this assign explicit a higher manager number to a UI that should connect to a specific computer (e.g. "-num 20")!
Messages in the message direction
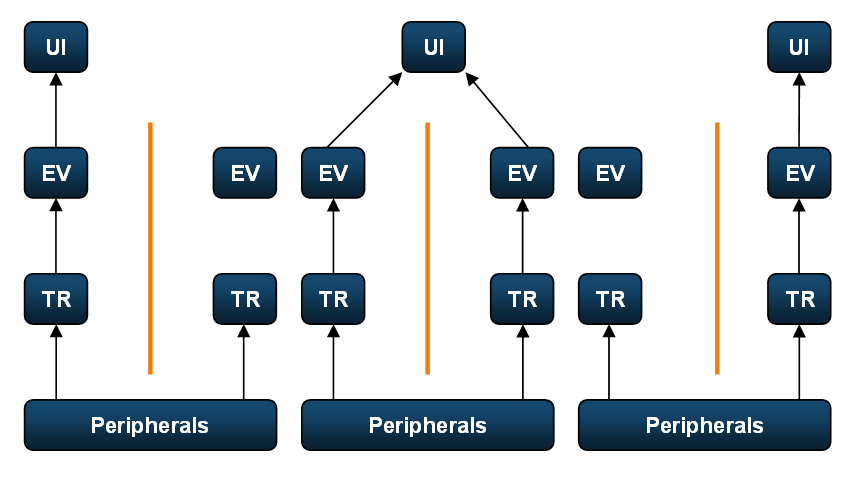
With the aid of the following graphics the run of the messages in the split mode is visualized. In the graphics the left side is to be regarded as active and the right side as test system. In addition you have to distinguish for which data space (either for a DP, which exists only in the active system or only in the test system or on both computers) the value, which is reported from the periphery, is defined for.
- Data point in the active system
- Data point in both systems
- Data point "TestDP_split" in test system
The first figure shows the message logic in case that the value that is reported from the periphery is represented on an element in the active system. The UI has to be switched on the active computer.
The UI`s between the computers are switched via the context menu for the UIs, which is opened via the system overview panel.
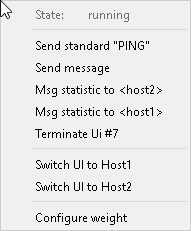
With the entry Switch UI toeiwrk017 or Switch UI toeiwrk028 you switch a UI on the Event Manager of the active or on the Event Manager of the test system. The setting defines which servers values will be accepted (the values of the other server will be discarded, see description below). It is to consider, that commands will still be sent to both server, regardless of the selection for the "Switch UI" option.
The second figure (see "Message in the message direction") shows the message direction in case that the value received from the periphery, is represented on an element, which exists on both systems. It does not make a difference on which computer the UI is switched on. The drivers on both systems process the value from the periphery and forward this to the Event Manager. Both Event Managers again forward the value to UI. Finally the UI decides from which Event it accepts the value. The other value is discarded.
If the element is located on the test system (like the new created data point "TestDP_split" in the example), the UI has to be connected to the right side. This case is shown in the third figure.
Messages in the command direction
The message logic for messages in the command direction is described with the aid of graphics. The left system is to be regarded as active and the right system as test system.
- Data point in the active system
- Data point in both systems
- Data point "TestDP_split" in the test system
The first figure shows the message logic in case that the value, which is sent to the periphery, is only set on one data point element in the active system. The UI has to be switched on the active computer when setting the value. The switching of the UIs between the computers takes place in the context menu for the UIs, which is opened via the system overview panel (see also context menu for the UIs). Additionally the driver has to be active on the system that also shows the element whose value is passed to the periphery. (in the figure above the active driver is marked orange). The switching of the active driver takes place in the system overview panel via the Active driver button.
The second figure shows the message logic in case that the value, which is sent to the periphery, is set on an element that exists on both systems. Thereby it does not make a difference on which computer the UI is switched or which driver is active. The UI sends the value to both events, these again to the drivers and the active driver passes the value to the periphery. The other driver discards the value.
In the third figure the element is located in the test system (as the data point "TestDP_split" created in the example) and the UI has to be connected to the right side. In this case the driver on the right side (test system) has to be active.
The system overview panel in the split mode looks like in the following figure:
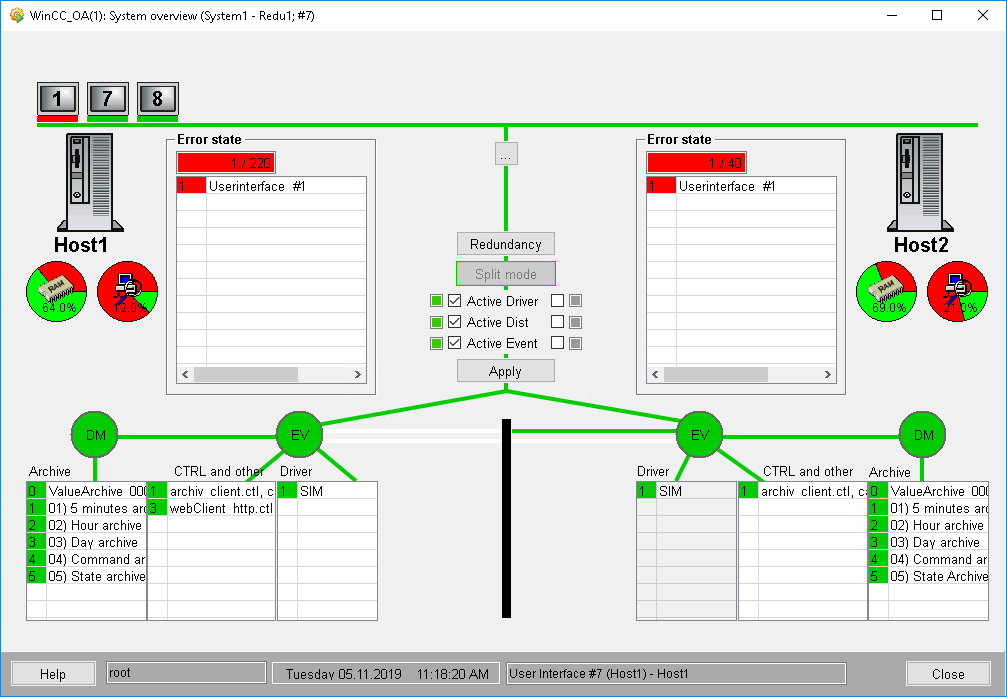
In the system overview panel the system with the active driver is visible (in the figure above the table "Driver" is activated on the computer eiwrk017). Via the button Active Driver you can switch the driver on the desired system active, on the other system the table "Driver" is grayed out.
If the redundant project is additionally distributed (this means that the redundant system is connected to further WinCC OA systems) there are two additional buttons with the name Active Dist and Active Event in the split mode. Via the button Active Dist you specify which Dist Manager should be active. Since the single systems communicate via the Dist Manager in a distributed system and the Dist manager always contacts the active Event Manager, the active Dist Manager has to be specified in the split mode (since both Event Managers are active in this case).
With Active Event you don't set the Event-Manager (both Event-Manager have to be active in order to process received messages), however, you specify which SplitActive is active.
Although both Events have to be active in the split mode, only one Event is allowed to forward messages to the other system (only one Event may forward dpSets to external systems, otherwise the commands would be processed twice in the external system). Since both Events are active, another flag is needed to control this. The _ReduManager.SplitActive flag.
The Redu manager data point element SplitActive is TRUE for the active Event side.
It's possible to activate the three managers on different systems, however it makes more sense to activate them on the same system.
The Redu manager data point element SplitMode contains the information whether the SplitMode is activated or not.
In addition to the already specified entries you can see the computer name the UI is connected to (... - Eiwrk028) in the system overview panel (see System overview in redundant systems). Via the button Redundancy the state returns to redundancy. Before the state returns to redundancy a query (if the original or the new configuration should be used) is executed. Choose the computer whose configuration you want to use from the pop-up window. The project on the other computer is restarted.
While the project on the other computer is restarting, it will be hidden in the system overview panel.