Event Manager Connections
The Event Manager Connections panel displays the number of system messages sent and received by each manager. There is a second tab for distributed systems (Host 2).
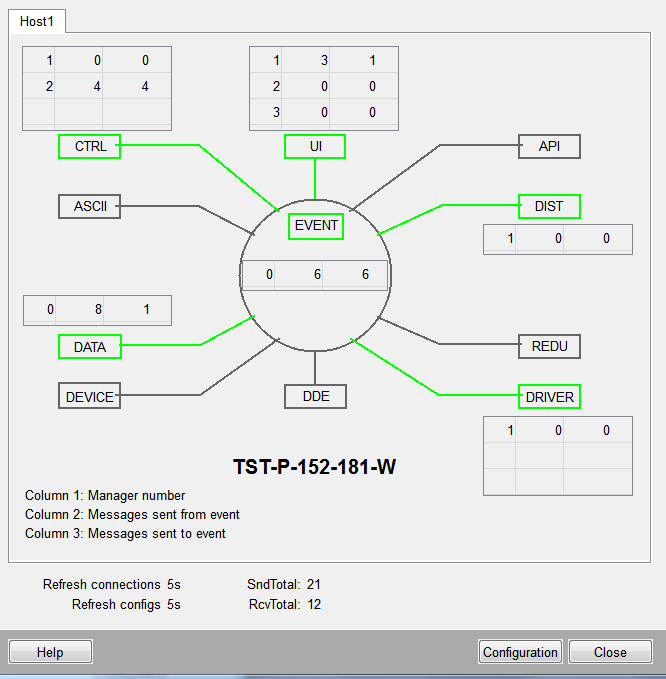
For managers with a connection to the Event Manager, the following data is shown in a table:
-
1st column: manager number
-
2nd column: number of messages sent by the event
-
3rd column: number of messages received by the event
On the bottom of the left side you find the current values for the updates of messages and configs. You define these value in the panel configuration.
Click on Configuration to open the following child panel:
-
Here you can specify the update time (SecToRefresh) for the configs or messages (see WinCC OA Diagnostics, Vision Reference).
Another click in the table rows opens a panel containing three tabs. The top line shows:
-
the total number of messages (sent, received)
-
the connected managers with associated manager number
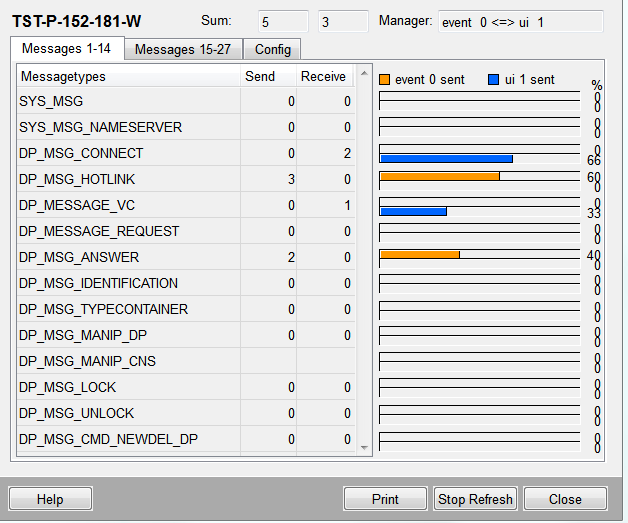
The messages tabs show:
-
The message type
-
The number of sent, received messages for each type
-
Bars: represent each message as a percentage of the total number of messages.
If the values equal "0", this means that no data has been sent - the statistics are disabled; thus no values are sent. You can disable the statistics if you do not want to slow down performance unnecessarily. To do this, set the update times for the connection and configs to 0.
The total of all messages sent in this time period equals 100 % (separate figures for the send and receive direction). Read about the meaning of the telegrams in the chapter Message Diagnose.
The bars are scaled to this maximum figure (per time period, per send, receive direction). If, for example, a total of 100 messages have been sent, the bars might indicate that 50 messages of one type have been sent, 10 of another type and 40 of another type.
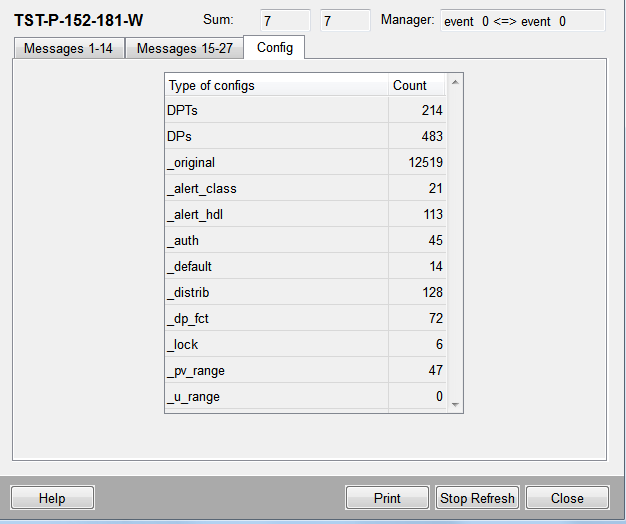
The Config tab lists the DPTs, DPs, configs and the number of each.
If you click in the Messages table you can track the changes in messages over time in a trend diagram.
Clicking on the buttons Legend and Toolbar will show or hide these elements.


