System overview in distributed systems
Open the system overview panel via the System management panel.
The System overview panel is opened via the System overview button on the Diagnostics tab:
Description of the panel
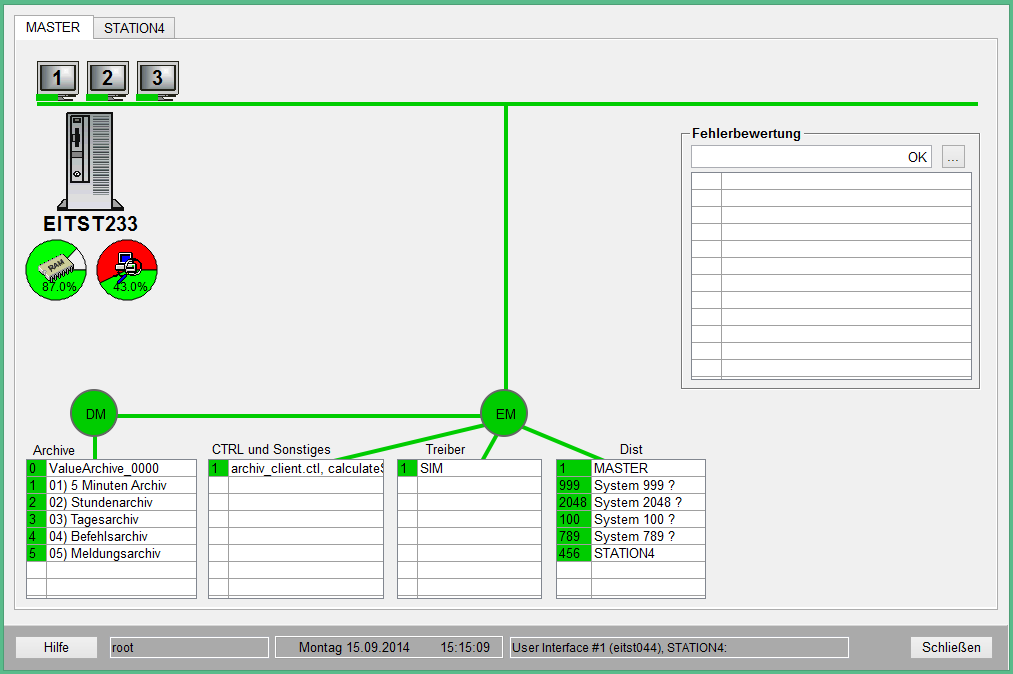
The structure and the functionality of the system overview panel is basically the same like the system overview panel in a single system (see also System overview in single systems). The created distributed systems are shown on single tabs and the system names are shown as titles on the tabs. If systems are added at runtime, these systems are established dynamically in the system overview and the specific tabs are shownautomatically (if the connection exists).
Furthermore (contrary to a single system) there is the table Dist where all Dist Managers and their statuses are shown.
Every 20 seconds it is checked if all of the shown distributed systems are still available (online). If not, a red warning symbol will be displayed on top of the Dist table.

The action panel that is opened by clicking the single archives (see also Swap out/backup archives) can only be opened for the archives on the own system (e.g. when the UI from which the system overview panel was opened runs on the system "dist_1" the actions panel of the archives can only be opened on the "dist_1" tab via click on the archives!
The status bar in the lowest part of the system overview panel displays the current user, date, time as well as details on the user interface the panel was opened with. In the figure above the details on the UI show the following line:
Windows User Interface #1 (EIWRK234), dist_1:- #1 : is the number of the UI.
- (EIWRK234): corresponds to the display the UI is running on.
- dist_1 : is the system name the UI was started on.
In a redundant distributed system where the redundant system is in the split mode additionally the computer on which the UI was currently switched, is shown (e.g. the following entry):
Windows User Interface #1 (EIWRK234), dist_1: Eiwrk028See chapter Redundancy in split mode of the redundancy documentation for further information on the split mode.
Unknown System
If a system is not known to other systems, a question mark is shown at the end of the system name. In the figure below the systems "System 999 ?", "System 2048 ?", "System 100 ?", "System 789 ?" are not known to system "STATION4".
Configuration of the error weighting
The table Error state on the right side of the system overview panel shows the error status on a specific system. The configuration of the error weighting via the available panels is described in detail in the chapter System overview in single systems.
If you open this panel on a foreign system (this means you switch in the system overview panel to a tab that shows a foreign system - in the figure System overview - a distributed system this would be the system "dist_2" since the UI the overview panel was opened from runs on system "dist_1" and the "dist_1" is the local system) this is also shown on the Manager tab in the combo box used for selecting the alert class with the name Foreign system!
Contrary to the configuration of the error weighting in a single system there is a third tab Distributed Connections for distributed systems. The weighting of the connection to other systems, which are linked together with a dist manager in a distributed project, is configured on this tab.
The configured weightings are visible in the table Connection (the system name, system number and the weighting are shown on each row). You can change the settings of defined connection by selecting it or add a new connection with the desired settings to the table. In case of errors e.g. Dist Manager on system dist_2 fails, the configured weighting is included in the calculation of the error status. The settings that you can create in the lower part of this panel (Append/Update) are same as the settings that can be configured on the Manager tab of this panel. Instead of selecting the manager you select the system to which there is an existing connection and that should be monitored. See chapter System overview in single systems for details on the settings. Additionally there is the check box System is redundant, where you can define whether the system, which connection should be monitored, is a redundant configured system (this make sense, when the system was connected once and the current state cannot be retrieved).
 Example: How to add a system with a weighting
Create your settings as shown in the figure above (Distributed Connections tab).
- Choose the desired system from the combo box (e.g. dist_2).
- Assign the weighting 250 to the system dist_2.
- Configure an alert handling with alert class in order to display an alert in the alert panel in case of errors.
- Activate the check box Monitor redundant network (the dist managers are provided with a redundant network connection in this example).
- After creating the settings click on the corresponding buttons to apply the settings in the table. Selected entries in the table can also be deleted (see Default buttons on configuration panels).
After executing the steps of the examples described earlier (adding a system with a weighting) and an error occurs (the Dist Manager on the system 1 looses the connection to system 2) the table Error state on the tab for the system 1 (dist_1) in the system overview panel looks as follows:
In the table Error state"Dist connection" + "System name (if known)" + "System number (in parenthesis)" is shown if a dist connection fails and this is configured with a weighting.
All error statuses/weightings are summed and shown at the top (250/542 - 250 is the sum of the weightings for all upcoming errors and 542 is the sum of all configured weightings). In the table below you see the single errors on the specific computer with the set weighting. On the tab for the system 2 (dist_2) in the system overview panel a figure and the text "Missing connection" are shown.
Notes
Manager number, older versions
Please note that for older systems the counting logic inside of the panel has been changed, therefore differences within the system overview can occur if older project versions (e.g. 3.11) are connected to newer project versions (e.g. 3.17). This ONLY effects the displayed information, internally the correct manager numbers are used.


