DP information
In WinCC OA you can obtain information on each data point element and its measured values or display the corresponding trend at runtime.
Very similar to the Simple STD_symbols (see STD_INDICATORS), the panel <wincc_oa_path>/panels/vision/dpe_info.pnl displays measured values, details about the element or the trend of the values.
Advantage:
The information about each measured value is available at runtime. Furthermore, you can set or change a set point. By setting either TRUE or FALSE, you can start or stop any device.
The panel dpe_info.pnl includes a number of tabs that are
available or dimmed depending on the type of the DPE. As an example, the tab Archive
exists only for archived data point elements. The following figure uses the data point
element ExampleDP_Trend1 as an example. You generate the values with the help of the
panel <wincc_oa_path>/panels/examples/trend .
Common tab
-
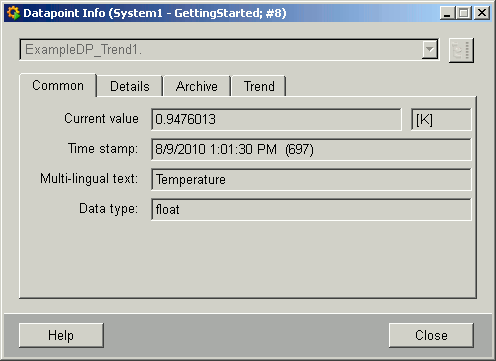
Current value:
Indicates the current online value of a data point element. Each change is displayed. This also applies if you set a "new value" in the text field (apply the change by pressing ENTER).
-
Unit :
If an unit has been defined, then the field next to the online value indicates the unit. In the example, [K] has been selected as temperature unit.
-
Time stamp :
Indicates the source time of the online value. Each value change leads to a new source that "marks" the value.
-
Description:
If it exists, the description of the data point element Falls is displayed (see also config _common).
-
Data type:
Displays the data type of the data point element.
-
New value :
You can input values into this text field at runtime. Use this feature either for changing set points or to start and stop individual devices.
-
Close :
Closes the panel.
-
Help :
Opens this topic in the online help
Details tab
-
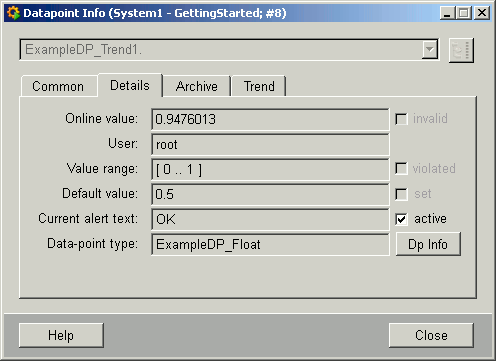
Online value
This field displays the current online value.
-
invalid :
This flag will be set if the online value is invalid.
-
Value range
This field indicates a defined value range (see config _pv_range).
-
violated :
This flag indicates wether a value range has been violated.
-
Default value :
This fields indicates a defined default value (see config _default).
-
set :
This flag indicates wether a default value has been set due to an invalid original value.
-
Current alert text:
If an alert handling has been configured, this field contains the alert text for the current status.
-
Data pointtype:
Displays the corresponding data point type.
-
DP Info :
Opens the following panel containing further information on the measured value:
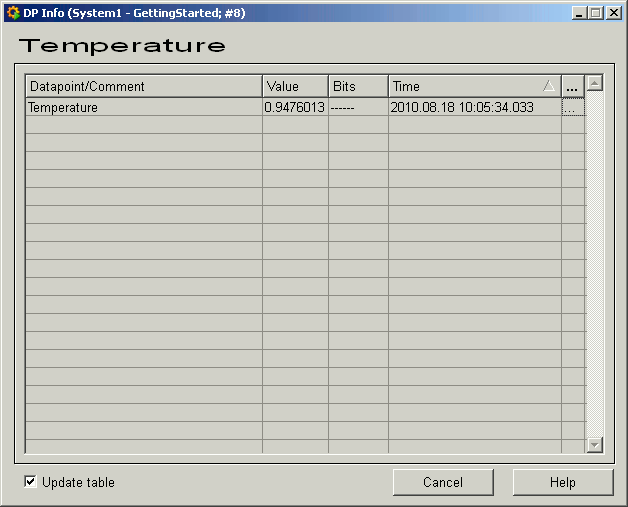
The table contains all data point elements of a data point type either as name or description, the values, the status (bits) and the source time. The eclipsed buttons open detailed information about events or alerts (see Alert table).
Archive tab
-
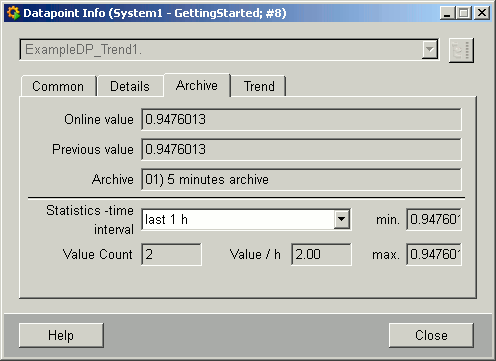
Online value :
Displays the current online value.
-
Previous value
Displays the previous online value.
-
Archive :
Displays the name of an archive where a value has been saved (for example, 01) 5 minutes archive).
-
Statistics time :
This combo box lists several time ranges for the statistics of the values.
-
min :
Indicates the lowest value of the selected time range.
-
max :
Indicates the highest value of the selected time range.
-
Value Count :
Indicates the number of values within the selected time range.
-
Value/h :
Indicates the values per hour. The number of values in the selected time range has been extrapolated to an hour.
Trend tab
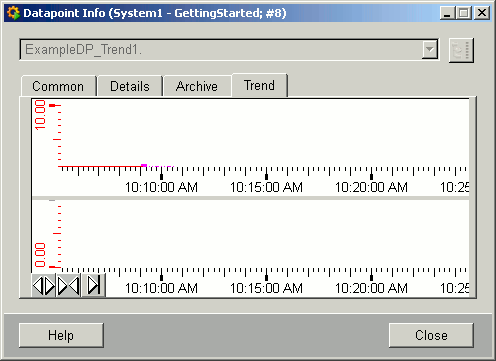
This tab displays a value's trend curve within a timerange. The time range can be varied with the buttons in the bottom left:
![]() Leads to a
wider time range. The resolution of individual values decreases.
Leads to a
wider time range. The resolution of individual values decreases.
![]() Leads to a
smaller time range. The resolution of individual values increases.
Leads to a
smaller time range. The resolution of individual values increases.
![]() Displays the trend
up to the last saved value.
Displays the trend
up to the last saved value.


