Variable Trend
In the previous section, we used a trend as a fully configurable, fairly complex graphical object. Based on this, users in WinCC OA also have access to a more advanced tool for displaying value-time curves: the "Variable Trend".
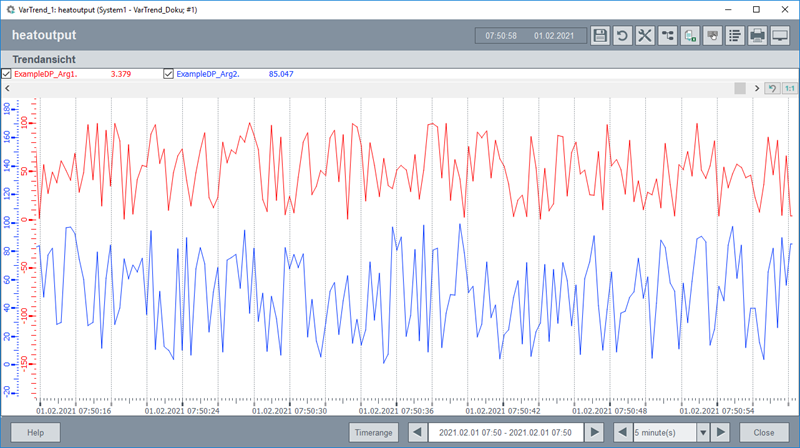
Unlike in the section Displaying Historical Data in Trends, the Variable Trend can be used to display any curves and groups of curves. The composition of which curves should be viewed together over which time periods is determined by the end user at runtime (User Interface/Module Vision). These compositions can also be saved as configurations, allowing the user to easily access their "usual" views with a single click.
You can open the variable trend over the System management panel > Diagnostics > Variable Trend. You can, of course, also use an arbitrary button for this call. In the panel topology (see Panel topology) that will be described later, a button that opens the variable trend already exists.
For more information on the variable trend, see chapter Variable trend, basics.


