"xArrayGridLineStyle"
The function "xArrayGridLineStyle" sets the style of the grid lines for the X axis of a one dimensional array.
Synopsis
setValue(string shape, "xArrayGridLineStyle", string style);
getValue(string shape, "xArrayGridLineStyle", string
                &style);
shape.xArrayGridLineStyle(string style);
Parameters
| Parameter | Description |
|---|---|
| shape | Name of the object |
| style | The style of the grid line, for example, "[solid,oneColor,JoinMiter,CapNotLast,4]". See chapter Line-type string for more information. |
Description
The function "xArrayGridLineStyle" sets the style of the grid lines for the X axis of a one dimensional array.
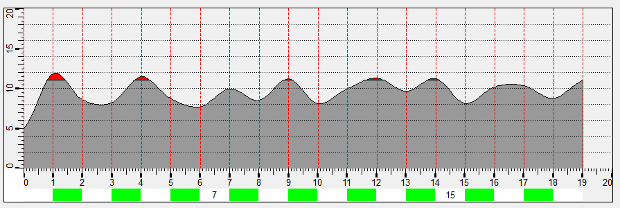
![]() Example
Example
In the following example, the style of the grid lines will be set to "[dashed,oneColor,JoinMiter,CapRound,1]".
main(bool enter)
{
  BAR_TREND1.xArrayGridLineStyle("[dashed,oneColor,JoinMiter,CapRound,1]");
}
Assignment
Bar trend