"data" -
Time element array
"data" -
Time element array
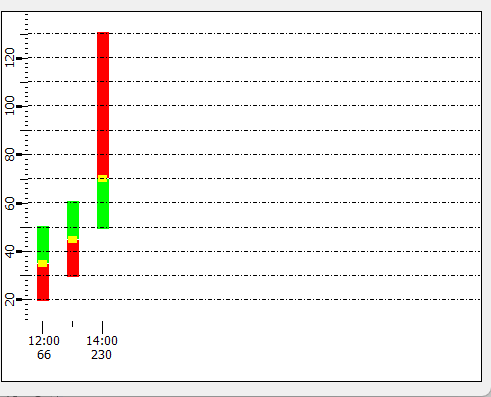
Data for the bar trend in the time element array display mode.
Synopsis
setValue(string shape, "data", dyn_float DataAvg, dyn_float DataMax,
                    dyn_float DataMin, dyn_float DataS, dyn_long DataTime, dyn_int
                    DataMeter);
getValue(string shape, "data", dyn_float &DataAvg, dyn_float
                    &DataMax, dyn_float &DataMin, dyn_float &DataS, dyn_long
                    &DataTime, dyn_int &DataMeter);
shape.data(dyn_float DataAvg, dyn_float DataMax, dyn_float DataMin, dyn_float
                    DataS, dyn_long DataTime, dyn_int DataMeter);
Parameters
| Parameter | Description |
|---|---|
| shape | Name of the object |
| DataAvg | Mean values |
| DataMax | Maximum values |
| DataMin | Minimum values |
| DataS | Standard deviation |
| DataTime | Time values |
| DataMeter | Length |
Description
This attribute can be used to define the trend values. Each element consists of a minimum, maximum and average value assigned to a specific time value on the X-axis.
Example
main()
{
  shape bt=getShape("BAR_TREND1");
  dyn_float min, max, avg, s;
  dyn_int meter;
  dyn_long tVariable;
  // Values
  min=makeDynFloat(20, 30, 50);
  max=makeDynFloat(50, 60, 130);
  avg=makeDynFloat(35, 45, 70);
  s=makeDynFloat(10, 20, 30);
  tVariable=makeDynLong(makeTime(2000, 20, 9, 12, 00), makeTime(2000, 29, 9, 13, 00), makeTime(2001, 2, 4, 14, 00));
  meter=makeDynInt(66, 180, 230);
  // Setting the values
  setValue(bt, "data", avg, max, min, s, tVariable, meter);
  // Minimum and maximum value display
  bt.showRange=BAR_MINMAX;
  // Width of the bar sections
  bt.widthTop=10;
  bt.widthBottom=10;
  bt.widthCenter=7;
  // Set colors
  bt.colorTop="Green";
  bt.colorBottom="Green";
  bt.colorCenter="[100,100,0]";

  bt.yCenter(75);
  bt.yRange(170);
  bt.yStep(10);

  bt.xStep(1);
  bt.xWidth(30);

  // Update bar trend
  bt.flush();
}
Assignment
Bar trend