"xRange"
Defines the scale of the X-axis.
Synopsis
setValue(string shape, "xRange", float value);
getValue(string shape, "xRange", float &value);
shape.xRange(float value);
Parameters
| Parameter | Description |
|---|---|
| shape | Name of the object |
| value | Scale range |
Description
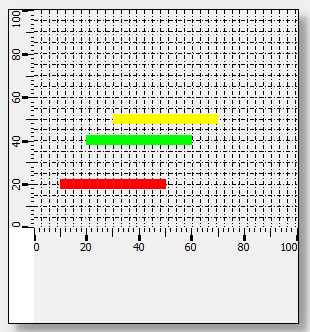
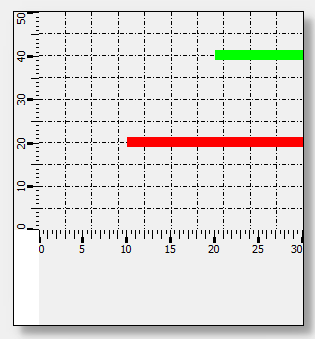
This attribute is used to specify or read the displayed range on the x-axis. The attribute "value" defines the range (unlike "yRange", however, this value is always an absolute value).
 Example
see "xOrigin"
Assignment
Bar trend