"data" -
Bars
"data" -
Bars
Data for the bar trend in the bar graph display mode.
Synopsis
setValue(string shape, "data", dyn_float x1, dyn_float x2, dyn_float y1,
                    dyn_float y2, dyn_string color1, dyn_string color2);
getValue(string shape, "data", dyn_float x1, dyn_float x2, dyn_float y1,
                    dyn_float y2, dyn_string color1, dyn_string color2);
shape.data(dyn_float x1, dyn_float x2, dyn_float y1, dyn_float y2, dyn_string
                    color1, dyn_string color2);
Parameters
| Parameter | Description |
|---|---|
| shape | Name of the object |
| x1 | Start coordinate for the bar on the X-axis |
| x2 | End coordinate for the bar on the X-axis |
| y1 | Y value of the bar |
| y2 | Y coordinate of the line |
| color1 | Color array for the bars |
| color2 | Color array for the line |
Description
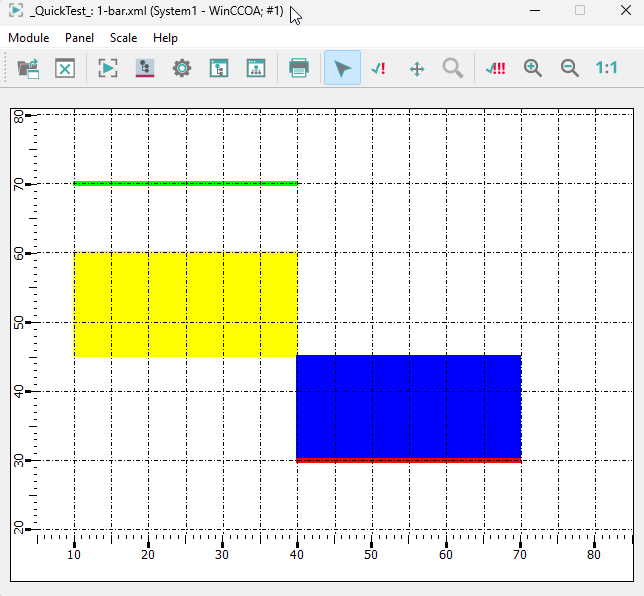
This attribute is used to specify the data for the "Bar" display mode. The width of the bar on the X-axis is defined by the parameter "x1" (start coordinate) and "x2" (end coordinate). The y dimension for this particular bar is set by the reference value (see "refValue") and the value in array "y1". In addition, a horizontal line is drawn at the position specified in the array "y2" (for example, set value). The color for the bars can be defined in the "color1" array, the color for the line in the "color2" array.
Example
main()
{
  shape bt=getShape("BAR_TREND1");
  bt.Type=1;
  dyn_float dx1, dx2, dy1, dy2;
  dyn_string c1, c2;
  //dx1 Start coordinate for the bar on the X-axis
  //dx2 End coordinate for the bar on the X-axis
  dx1=makeDynFloat(10,40);
  dx2=makeDynFloat(40,70);
  //Y value of the bar and Y coordinate of the line (green and red lines)
  dy1=makeDynFloat(60,30);
  dy2=makeDynFloat(70,30);
  //c1 = Color array for the bars, c2 = Color array for the line dyn_string c1, c2;
  c1=makeDynString("Gelb", "Blau");
  c2=makeDynString("Green", "Rot");
  setValue(bt, "data", dx1, dx2, dy1, dy2, c1, c2);

  bt.xCenter(5);
  bt.xRange(80);
  bt.xStep(5);
  bt.yCenter(50);
  bt.yRange(123);
  bt.yStep(10);
}