"xArray"
Additional data for the one-dimensional array. The xArray shows additional information for the X axis.
Synopsis
setValue(string shape, "xArray", dyn_float DataX, dyn_string Color,
                    dyn_string Label);
getValue(string shape, "xArray", dyn_float &DataX, dyn_string &Color,
                    dyn_string &Label);
shape.xArray(dyn_float DataX, dyn_string Color, dyn_string
                Label);
Parameters
| Parameter | Description |
|---|---|
| shape | Name of the object |
| DataX | X values |
| Color | Array containing the color strings |
| Label | Array containing the labels |
Description
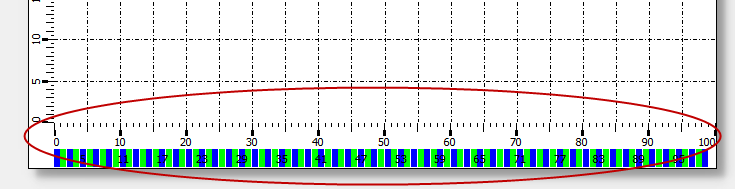
This attribute can be used to show additional information data in the one-dimensional array. The xArray shows additional information for the X axis. The values are passed in the array "DataX", the associated colors and labels in the arrays "Color" and "Label".
![]() Example
Example
main()
{
  shape bt=getShape("BAR_TREND1");
  int i, j;
  float xRange;
  dyn_float x;
  dyn_string color, ident;
  //Define X- and Y-axis of the bar trend
  bt.yOrigin=BAR_BOTTOM;
  bt.yCenter=0;
  bt.yRange=50;
  bt.yStep=5;
  bt.yPrec=0;
  bt.xOrigin=BAR_LEFT;
  //Determine x, color and ident
  getValue(bt, "xRange", xRange);
  for(i=1; i<=xRange; i++)
  {
    x[i+1]=x[i]+1;
    if(i%2==0)
      color[i]="Blue";
    else
      color[i]="Green";
    if(i%6==0)
    {
      j=x[i];
      ident[i]=j;
    }
    else
      ident[i]="";
  }
  //Setting the values
  setValue(bt, "xArrayShow", 1);
  setValue(bt, "xArray", x, color, ident);
  setValue(bt, "xArrayHeight", 20);
  setValue(bt, "xArrayGrid", 1);
  // Update bar trend
  setValue(bt, "flush");
}
Assignment
Bar trend