"data" -
Bar array
"data" -
Bar array
Defines the Y values to be displayed.
Synopsis
setValue(string shape, "data", dyn_float yValues);
getValue(string shape, "data", dyn_float &yValues);
shape.data(dyn_float yValues);
Parameters
| Parameter | Description |
|---|---|
| shape | Name of the object |
| yValues | Y values |
Details
The Y values of the bars can be set or read as type dyn_float using this attribute.
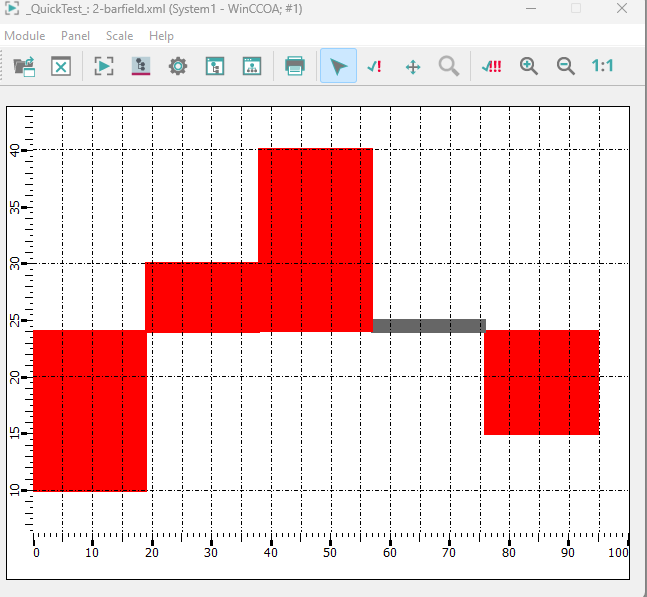
Example
main()
{
  shape bt=getShape("BAR_TREND1");
  bt.Type=2;
  dyn_float df;
  // Values
  df=makeDynFloat(10, 30, 40, 25, 15);
  // Width of the bars
  bt.xWidth=15;
  // Start position
  bt.xStart=0;
  // Setting the values
  setValue(bt, "data", df);

  bt.xStep(5);
  bt.xWidth(19);
  bt.yCenter(25);
  bt.yRange(150);
  bt.yStep(10);
}