"xGridLineColor", "yGridLineColor"
The functions "xGridLineColor" and "yGridLineColor" set the colors of grid lines for X and Y axes.
Synopsis
setValue(string shape, "xGridLineColor", string color);
getValue(string shape, "xGridLineColor", string &color);
shape.xGridLineColor(string color);
Parameters
| Parameter | Description |
|---|---|
| shape | Name of the object |
| color | The color, for example, "Red" or "Green" |
Description
The functions "xGridLineColor" and "yGridLineColor" set the colors of grid lines for X and Y axes.
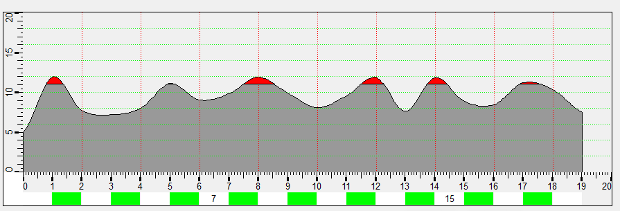
![]() Example
Example
In the following example, the color of the grid line for the x axis will be set to red and the color of the grid line for the y axis will be set to green.
main(bool enter)
{
  BAR_TREND1.xGridLineColor("Red");
  BAR_TREND1.yGridLineColor("Green");
}
Assignment
Bar trend