"yLines"
Defines how the Y lines are displayed.
Synopsis
setValue(string shape, "yLines", dyn_float DataY, dyn_float DataX1, dyn_float
                    DataX2, dyn_string line, dyn_string color);
getValue(string shape, "yLines", dyn_float &DataY, dyn_float &DataX1,
                    dyn_float &DataX2, dyn_string &line, dyn_string
                &color);
shape.yLines(dyn_float DataY, dyn_float DataX1, dyn_float DataX2, dyn_string
                    line, dyn_string color);
Parameters
| Parameter | Description |
|---|---|
| shape | Name of the object |
| DataY | Y values |
| DataX1 | X start values |
| DataX2 | X end values |
| line | Array containing the line types |
| color | Array containing the colors |
Description
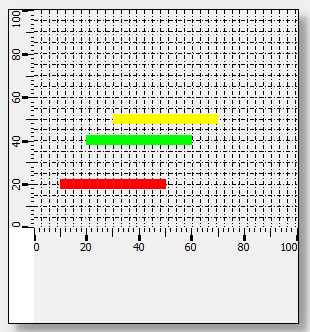
This attribute can be used to define precisely how the Y lines are displayed with the Y values of the lines specified in the array "DataY" and the X coordinates in the arrays "DataX1" and "DataX2". An individual line type and color string is defined for each line via the arrays "line" and "color".
![]() Example
Example
main()
{
  shape bt=getShape("BAR_TREND1");
  dyn_float dy, x1, x2;
  dyn_string line, col;
  string s;
  // Coordinates
  dy=makeDynFloat(20, 40, 50);
  x1=makeDynFloat(10, 20, 30);
  x2=makeDynFloat(50, 60, 70);
  // Colors and lines
  col=makeDynString("Red", "Green", "Yellow");
  s="[solid,oneColor,JoinMiter,CapNotLast,4]";
  line=makeDynString(s, s, s);
  // Setting the values
  setValue(bt, "yLines", dy, x1, x2, line, col);
  bt.flush();// Update bar trend
}
Assignment
Bar trend