Faceplates, Basics
A faceplate displays the extended operation dialog of a symbol. This means that in addition to values and states of a data point that are displayed in a symbol, the faceplate panel informs of further values and states. Furthermore, it provides the following functions:
-
acknowledgement of alerts,
-
the display of selected data point elements on the trend tab,
-
creation of notes for the current object instance (e.g. maintenance work of an engine),
-
the change of data point element values
When several monitors are used (multimonitoring), consider the following:
1) the monitor resolution of all monitors must be the same
2) monitors must be horizontally aligned
3) faceplates will be aligned only to the X axis.
Left click on a symbol to open its faceplate.
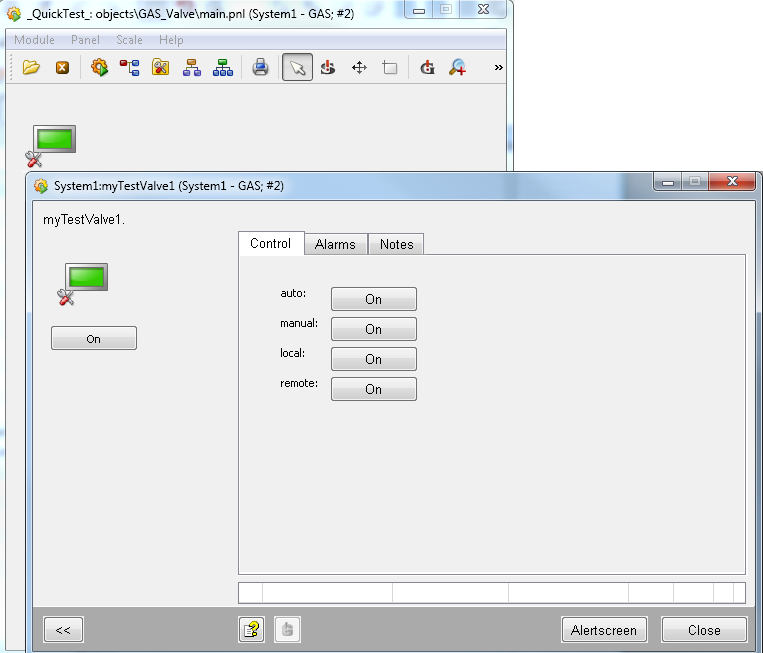
A faceplate shows the symbol that is displayed in the panel and information about the data point elements of a data point. This information is represented via an elementary symbol in the faceplate.
An elementary symbol is a reference panel with graphics elements, which are controlled via $-Parameters. From a graphical point of view, elementary symbols are buttons, text fields, dialog boxes, sliders, etc., which provide an additional range of functions (authorization functions, color change, animations, etc.).
Click on the ![]() button to open the
extended view of a faceplate. In most WinCC OA Libraries, there are
at least three available tabs ("Alarms", "Trend" and "Notes") in
the extended view.
button to open the
extended view of a faceplate. In most WinCC OA Libraries, there are
at least three available tabs ("Alarms", "Trend" and "Notes") in
the extended view.
-
Available tabs.
-
Opens the WinCC OA online help for the corresponding data point type.
-
Acknowledges a sum alert
-
Alert row with the most recent alert.
-
Opens the variable trend in a new window.
-
Opens the alert screen in a new window.
-
Closes the faceplate.
The three standard tabs that are available in most WinCC OA Libraries are:
-
"Alarms" - available if the sum alert handling data point config is available in the alarm node.
-
"Trend" - available if at least one data point element, whose trend curve should be shown in the Trend tab, was selected on the "Trend" tab of the PARA when selecting the data point type.
-
"Notes" - available if the data point element contains the general node with the data point element note, in which the internal data point type _STDLIB_Note is embedded. Furthermore, the config entry useNotes may not be set to FALSE.
Alarms Tab
On the "alarms" tab, pending alerts are displayed for the corresponding data point and can also be acknowledged (provided that the user has the corresponding authorization).
Via the ![]() button beneath the
"alerts" tab, you can acknowledge all visible alerts on the tab (sum alerts as well
as single alerts). This button is only activated when the "alarms" tab is open and
the user possesses the corresponding authorization for acknowledging alerts (authorization bit 5).
button beneath the
"alerts" tab, you can acknowledge all visible alerts on the tab (sum alerts as well
as single alerts). This button is only activated when the "alarms" tab is open and
the user possesses the corresponding authorization for acknowledging alerts (authorization bit 5).
Trend Tab
On the "trend" tab, trends for process values for the corresponding data point can be viewed.
Configure the data point element for the trend curve via the PARA module. On the "trend" tab, click on the data point type and select the data point element, whose progress should be shown.
To view historical data on the "trend" tab, add a WinCC OA archive config to the data point element.
Notes Tab
On the "notes" tab, you can create notes for the corresponding object instance (data point).
In the "new note:" create a note and save it by clicking the button ![]() . In the "last note:"
field, the most recently saved note is displayed.
. In the "last note:"
field, the most recently saved note is displayed.
Click on "delete" ![]() to
delete a note (the most recently saved note remains in the history).
to
delete a note (the most recently saved note remains in the history).
The "history notes" button ![]() opens the note archive. The notes of the last 6, 12 or 24 months can be
displayed here.
opens the note archive. The notes of the last 6, 12 or 24 months can be
displayed here.