Configuration of the Function alertGetPeriod
This chapter describes the function alertGetPeriod.
Function type
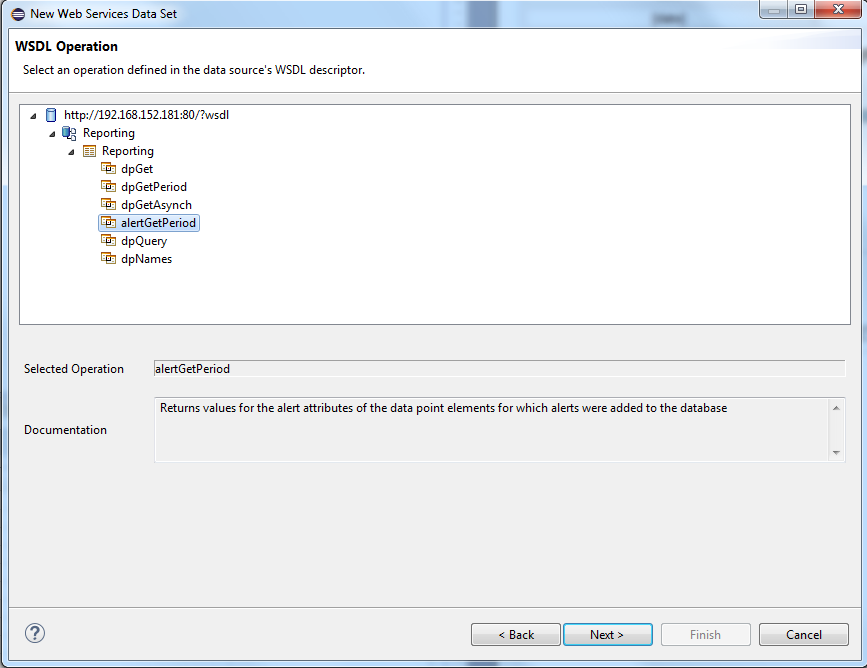
Select the function type alertGetPeriod after creating and naming a new data set (see create data set) and click on Next>.
Parameters
Shows the parameters that are available for the configuration. Select the parameters and click on Next>
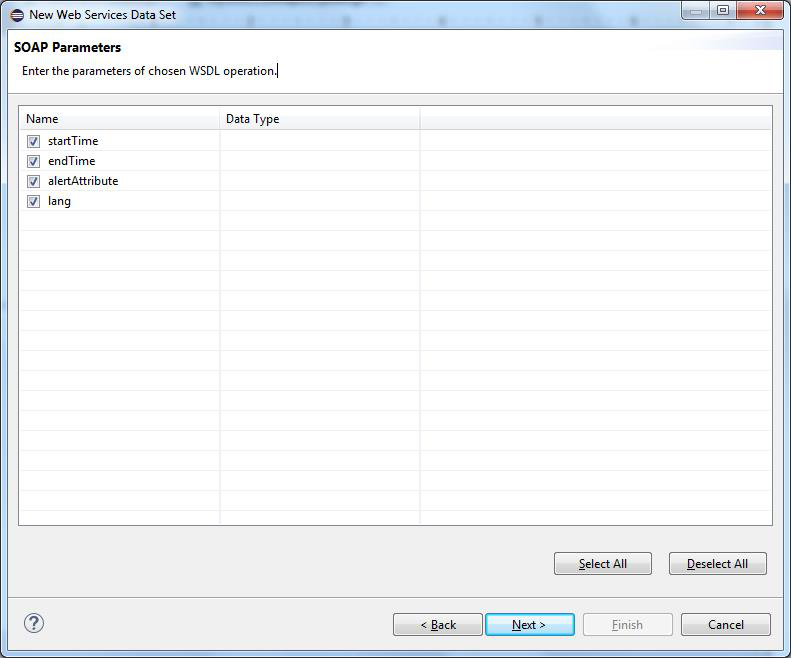
Function Parameters
| Parameter | Description |
|---|---|
| startTime | Start time of the time range to be queried |
| endTime | End time of the time range to be queried |
| alertAttribute | Data point element whose alert attributes are queried |
| lang | The project language. If you don't specify the language, the function returns the default language of the project. This means the default language set in the config file of the project (active language). If you, however, specify the parameter "lang" in the config file, the language of the "lang" parameter is returned. The parameter "lang" is optional. |
Wildcards must not be used for defining the data point element (alertAttribute parameter).
For further information regarding the function and the parameters, see the CTRL function alertGetPeriod. Note that the reporting function "alertGetPeriod" contains the parameter "lang" in addition to the parameters of the normal CTRL function.
SOAP Request
In order to retrieve values from WinCC OA, the generated SOAP request is transferred to the WinCC OA Reporting Manager in XML format. The SOAP request contains the dynamic parameters which are replaced by the queried values.
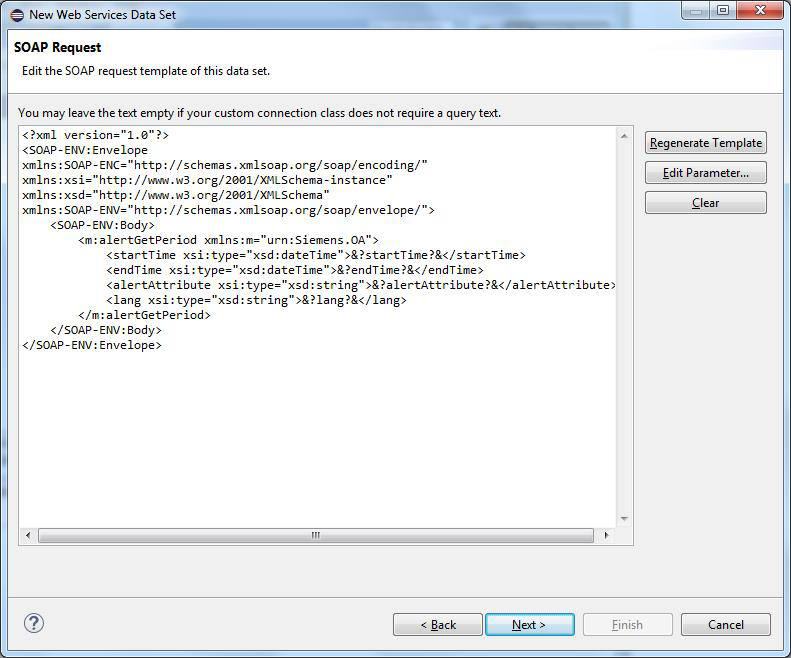
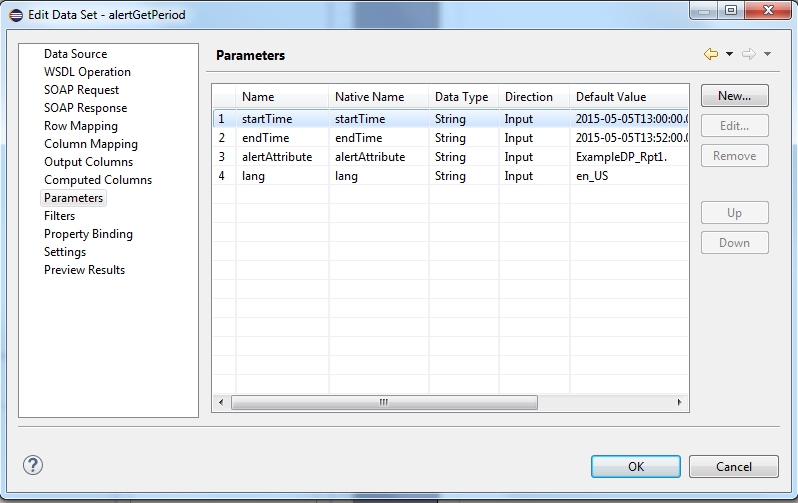
You can specify default values for each parameter via the Edit Parameter button. This is not mandatory but necessary if you want to check your settings later on (via Column Mapping - Show Sample Data).
Note that the data type cannot be specified here.
For this example the following default values are used:
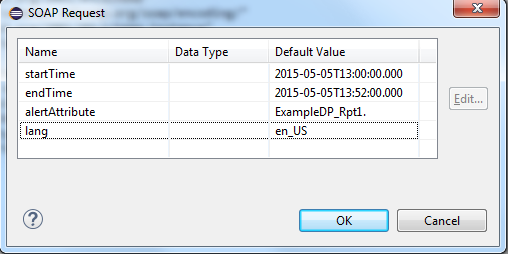
The time is specified in the format: <yyyy>-<mm>-<dd>T<hh>:<mm>:<sss>.<msec>, e.g. 2015-05-05T13:00:00.000
Click on the OK button and click on Next>.
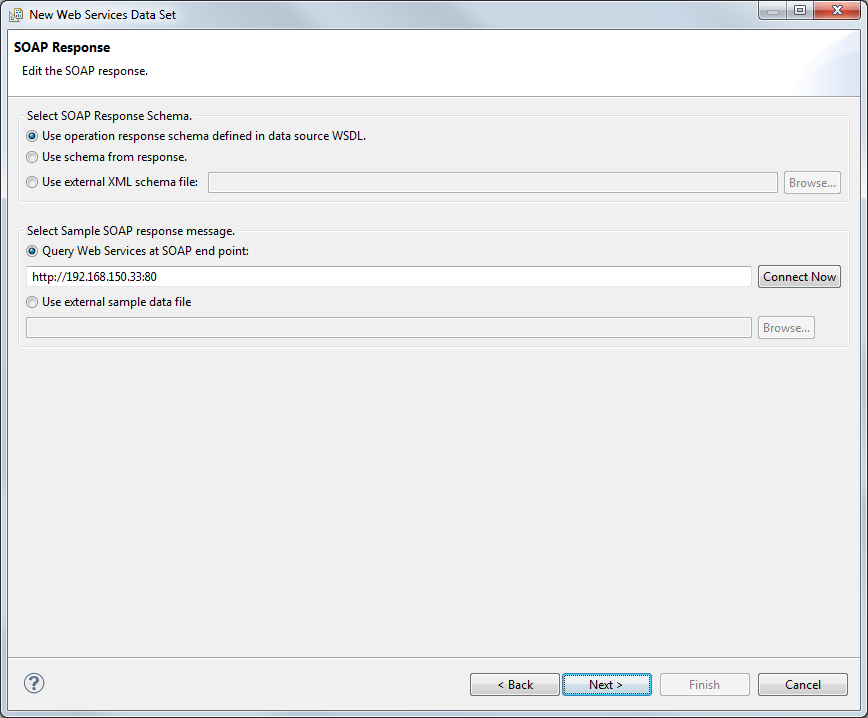
SOAP Response
No changes are necessary for this window. Click on Next>
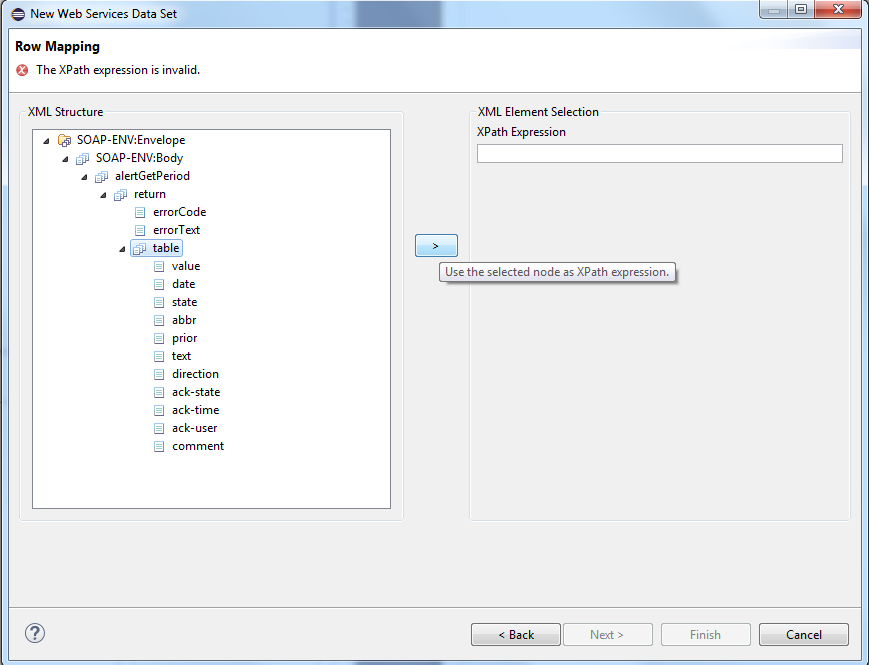
Row Mapping
BIRT reports must use data structured as tables (with rows and columns). In XML code, elements and attributes are used for providing data. Therefore, you have to define how the XML elements are linked with rows and columns.
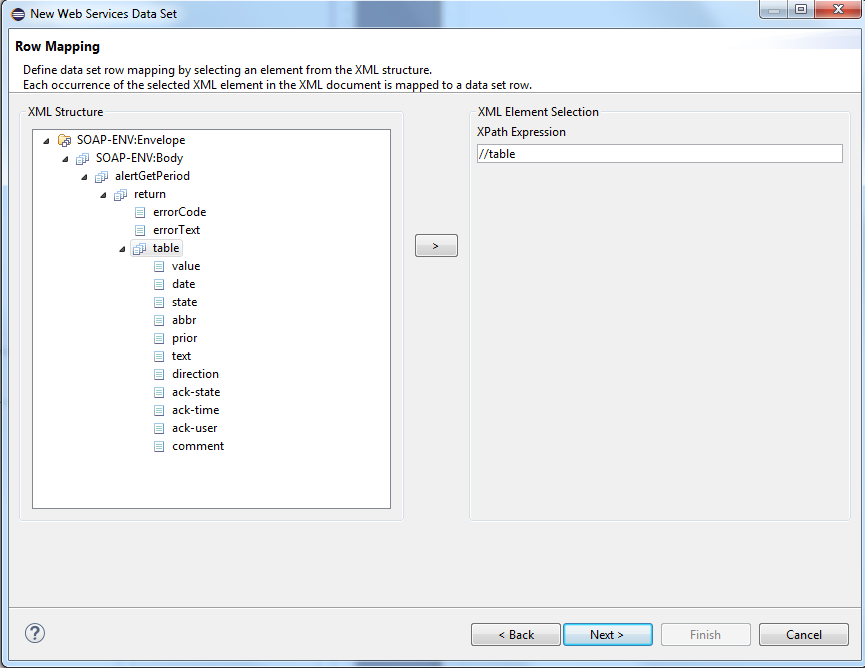
Use the Row Mapping to select which XML element is added as a new data set row. Each occurrence of the selected XML element is linked with a new data set row. Select "table" and click on the > button to select the XPath Expression (the selected element in the XML structure). You can pass an absolute, a relative or a user-defined path. A Path starting with a slash / is absolute, a path starting with // is relative.
The "Select or edit the XPath expression" window is opened. Select the option "XML elements named "table" at any location" and click on the OK button. Note that this option is mandatory in order to retrieve data.
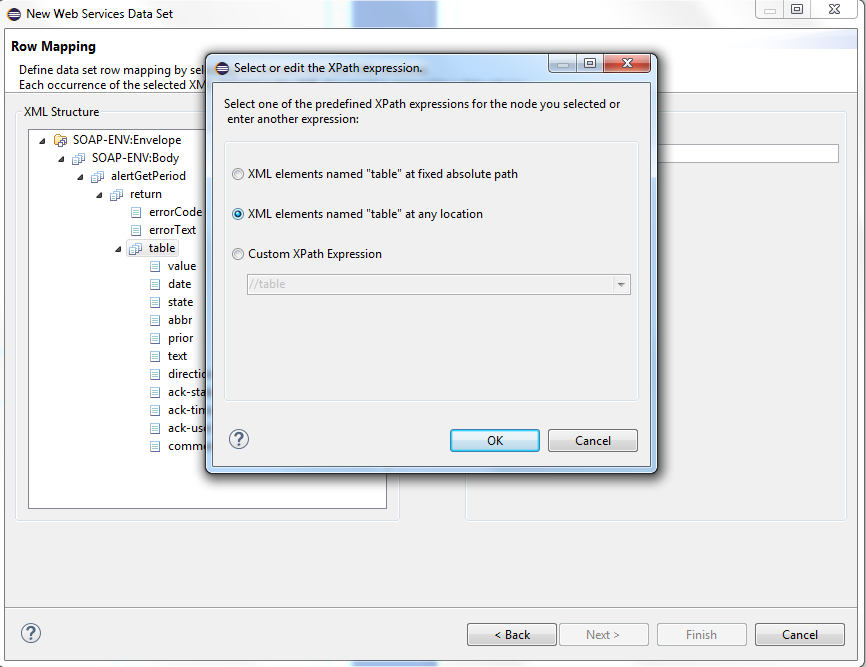
Click on the Next > button.
Column Mapping
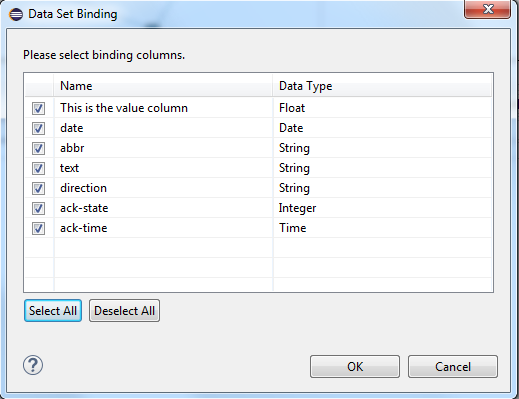
Column Mapping defines the columns for the table row. The columns are mapped to child elements or attributes within the selected data row element. In contrast to row mapping, you can select several elements. Select an element from the window on the left and click on the > button. The Column mapping window is opened
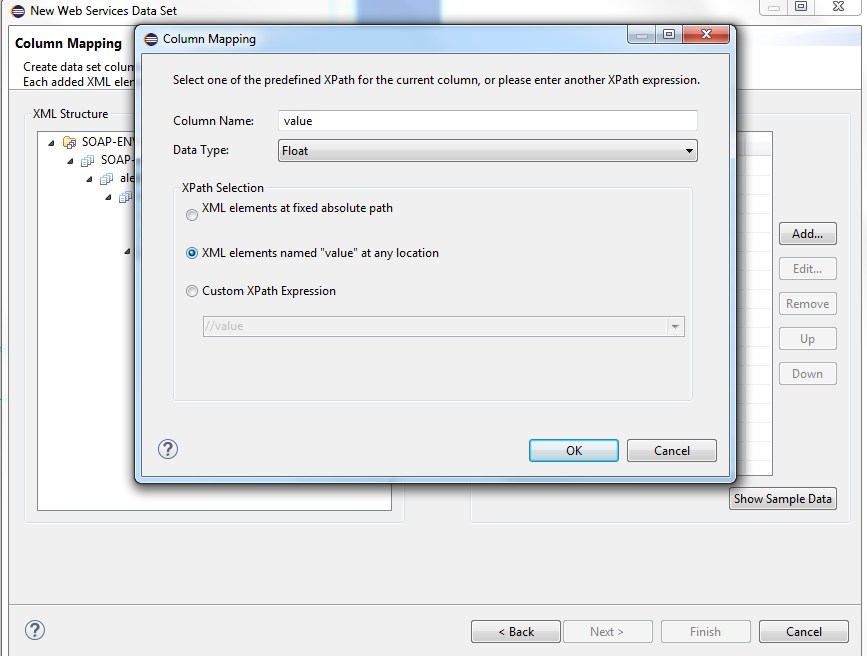
Select the data type "float" from the combo box as well as the option "XML elements named "value" at any location". Click on the OK button.
The element "value" is shown in the "Column mapping" window.
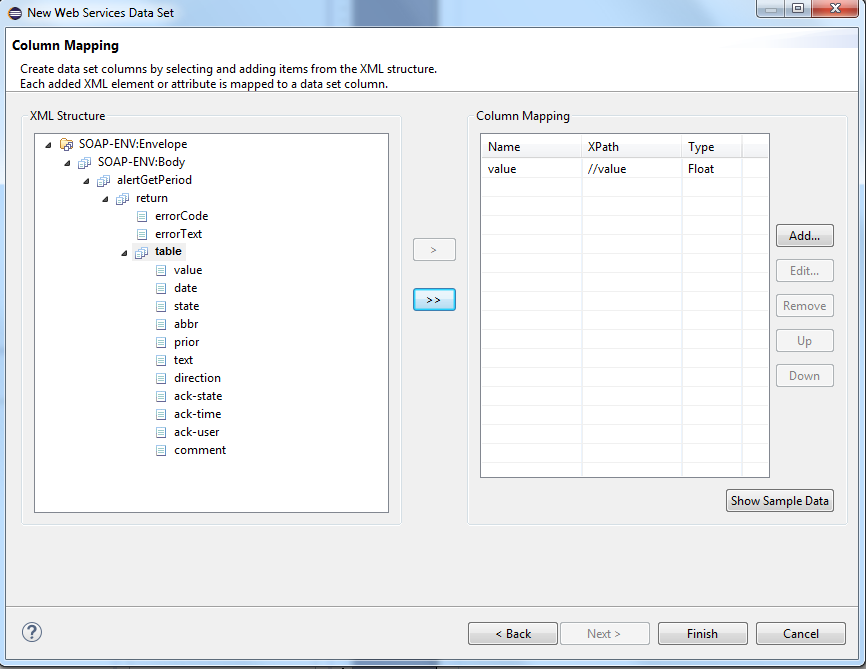
Repeat this step for the elements "date", "abbr", "text", "direction", "ack-state" and "ack-time". Select the correct data type for each element.
The BIRT tool queries dates and time as strings by default. You can, however, change the data type for dates and time in the output columns (see further below).
The column mapping contains the attributes:
value (the data point value),
date (the date when the value was set),
state (the attribute state contains the status bits_obsolete, _ackable etc. in a bit32.),
abbr (the Short sign (e.g.: A for an Alert) of the alert priority.),
prior (the Alert priority),
text (the State text),
direction (the Alert direction: CAME/WENT),
ack-state (the acknowledgement type of the alert),
ack-time (the acknowledgement time of the alert),
ack user (the user who acknowledged the alert),
comment (the user comment for an alert)
You can also return the error code and the error text in addition to the alert attributes. Since these two elements are located on the same level as the /table, you cannot return them in the same data set. Thus, a second identical data set must be created to display the error code and the text.
| Error code | Description |
| -1 | Data point not found |
| -2 | Answergroup error |
| -3 | Error in RDB Query |
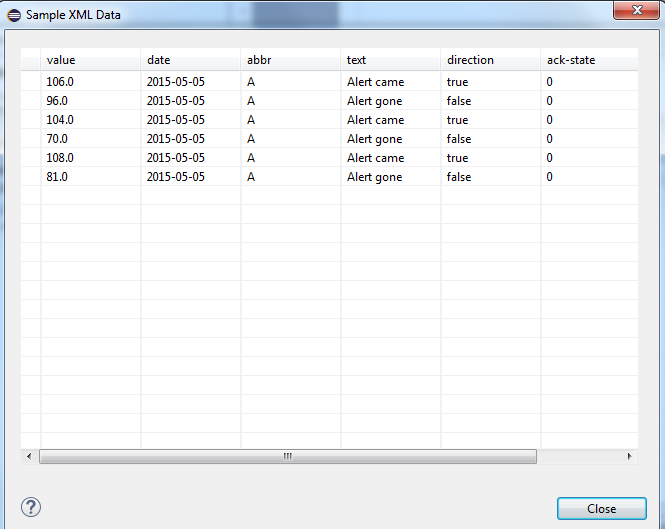
As mentioned before, you have to specify default values for the parameters in order to use the Show Sample Data button. If the default values are set, you can check the settings before completing the configuration.
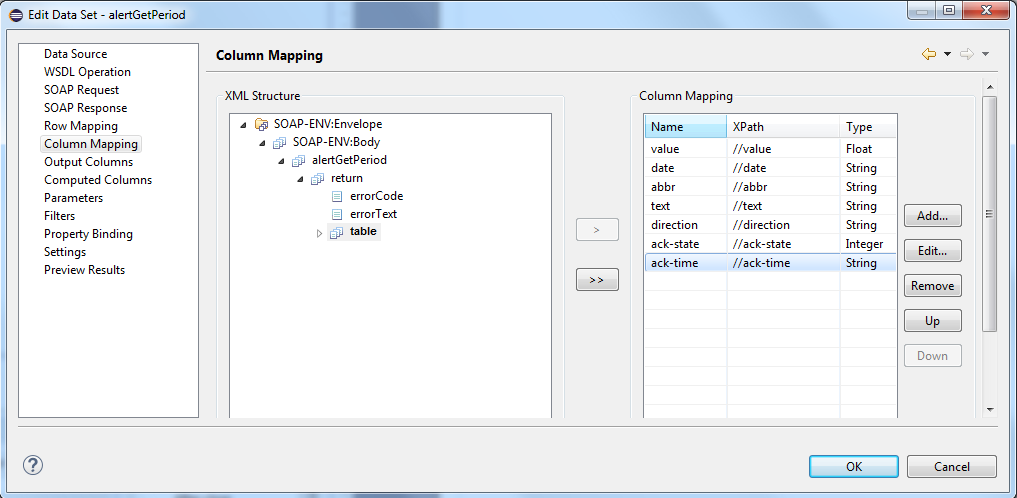
Edit Data Set
The Edit Data Set menu can be opened by double-clicking the data set in the data explorer. You can edit the entire data set configuration. The menu items Data source, WSDL operation, SOAP request, SOAP response, Row Mapping and Column Mapping are identical to the already described steps and are therefore not described in detail here.
The following menu items offer further configuration possibilities.
Parameters
Here you can specify default values in the same way as in the SOAP request earlier. These settings do, however, not have an influence on the output (Show Sample Data) in the column mapping but on the preview results. Furthermore, you can link the parameters with the report parameters here.
The BIRT tool queries dates and time as strings by default. You can, however, change the data type for dates and time in the output columns (see further below).
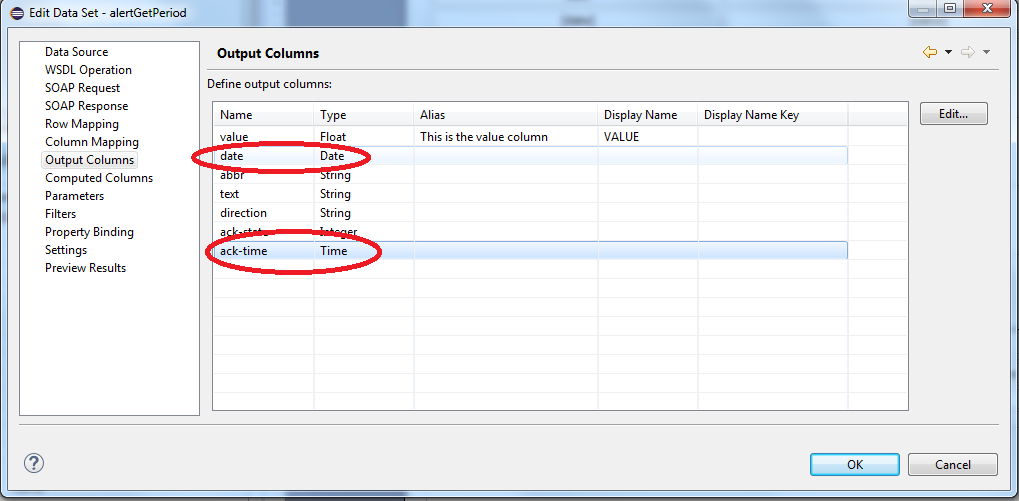
Output Columns
Here you can change the data types for the parameters. You can, for example, change the data type of date and time parameters. Dates and time are queried as strings but can be changed here to "Date" and "DateTime". Furthermore, you can add an alias and a display name which are shown when the report is opened in the worksheet.
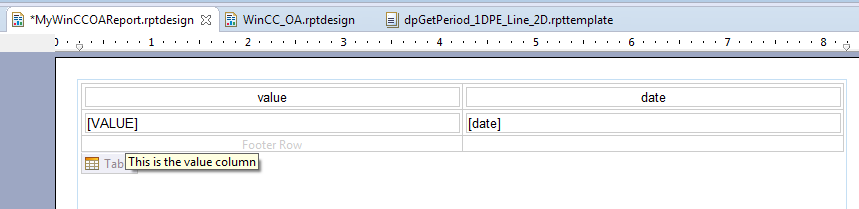
When you drag the function to the template in order to select the columns that are shown for the report (see chapter View report), the alias is shown:
The display name "VALUE" and the alias name "This is the value column) (as a tooltip) are shown in the template (in edit mode):
Computed Columns
Allows you to add additional columns to a report. The columns can, for example, be used to perform calculations.
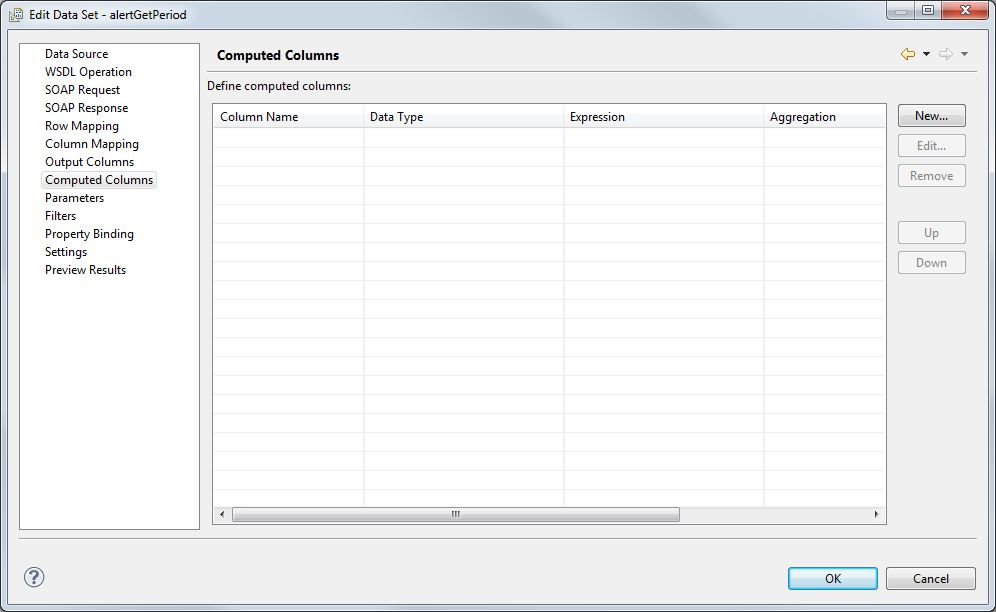
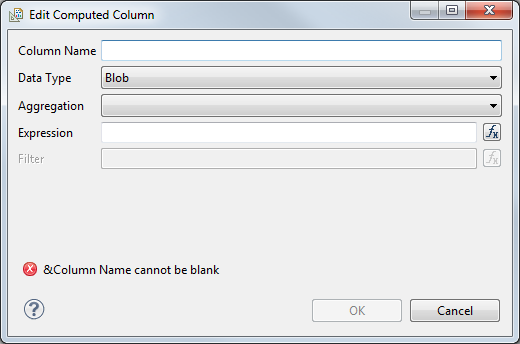
Click on New... and select a name and an appropriate data type for the data that is returned.
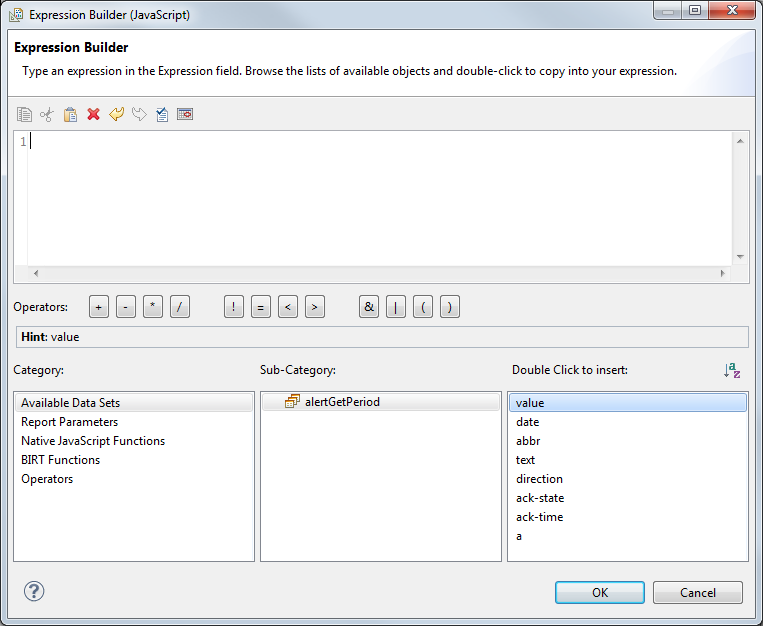
Under Expression you can define the content that is displayed in the column. The Expression Builder allows you to add the existing data sets and functions with a double- click. The column is displayed in the Output Columns after completing the configuration.
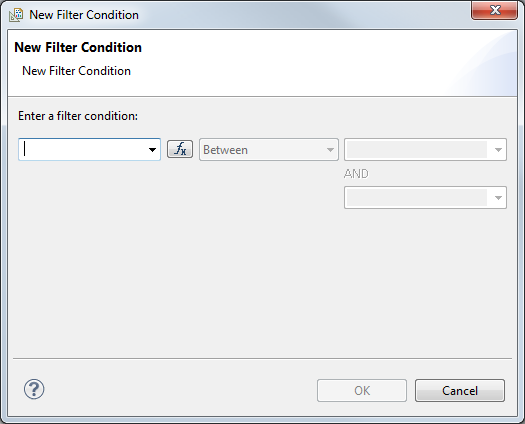
Filters
Defines which values are shown in the report and which are filtered.
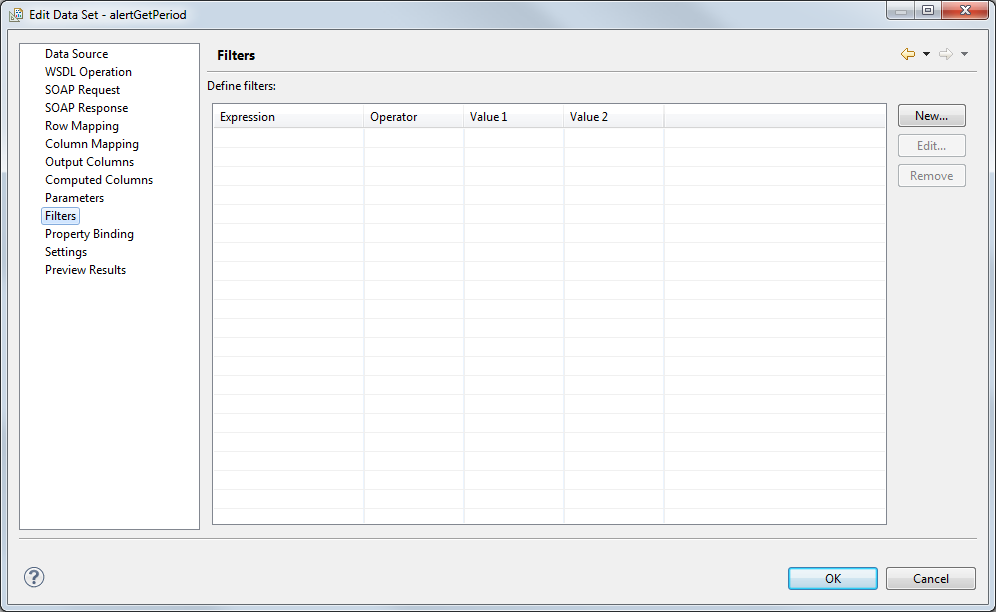
Click on New... and choose a column from the combo box. The content of this column is filtered according to the selected condition.
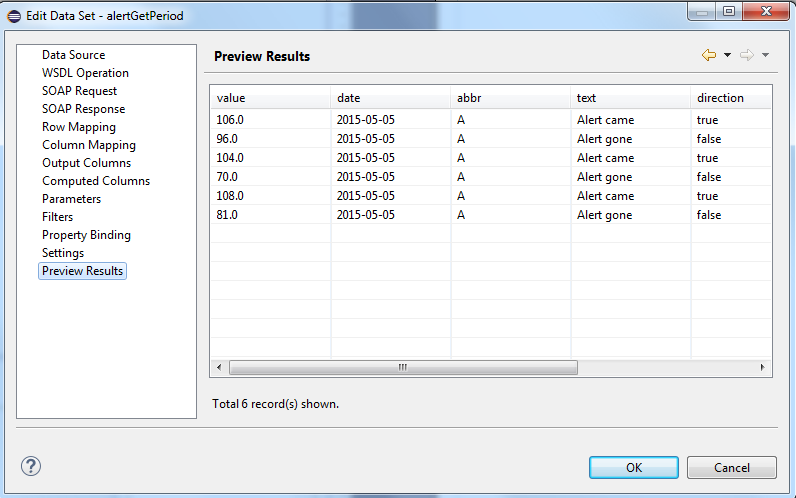
Preview Results
Can be used for checking the configuration and returns results according to the default values defined before under Parameters.
After creating a data set, you can create report parameters. Report parameters are necessary in order to use data sets fast and easily in a report. Otherwise the default parameters must be changed in the data set settings each time when generating a new report. You can also view the report directly without creating report parameters. For How to view a report, see chapter View report.


