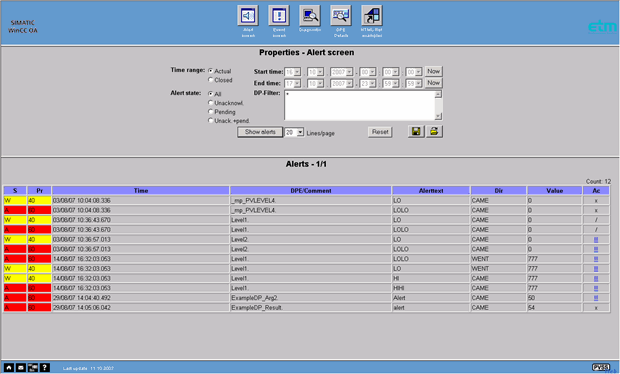
Alert panel of the HTTP Server
Click Alert panel on the start-up screen to open the following HTML page:
Figure: Alert panel as an HTML page

This HTML page contains a number of options (see alert panel for details). The top section is used to select filter properties:
Time range current, closed
Specifies whether to display the current status or history values.
It is not possible to display the open time range as you can on the alert panel. In the "current" mode the HTML page is not refreshed automatically. The HTML page has to be refreshed manually via the browser option.
State
What alert states to display.
Start, End
Time interval for query
Now
Current system time
DP Filter
Specify filters to display specific data points ("*" displays all data points, "Ex*" displays all data points beginning with "Ex" - see wildcards). Enter an exclamation mark "!" before <pattern> or the wildcard as prefix if all data points should be returned whose name does not contain the <pattern>, e.g. !<pattern>*, !*<pattern> or !*<pattern>*.
Lines/Page
Specifies how many lines to display per alert query results page.
Show alerts
The results of the query and any notes on the query are displayed in the bottom of the frame after clicking on Alerts.
Also, you can acknowledge the alarm in the system. However, this requires "acknowledge" user authorization.
To acknowledge, click on theQT acknowledgebox in the table and confirm acknowledgment by clicking on OK in the dialog. Details on the columns can also be found in the alert panel.
| Abbreviation | Description |
|---|---|
| K | Alert short sign |
| PR | Alert priority |
| Time | Time of alert |
| Data point element/description | Data point of alert |
| Alert text | Alert text configured for the data point (see alert handling) |
| RTG | Direction of alert (came, went, etc) |
| QT | Acknowledgement of alert |
| Example | Description |
|---|---|
| Working with the alert panel | Shows how to load your data into the alert panel HTML page |


