Structure of a template
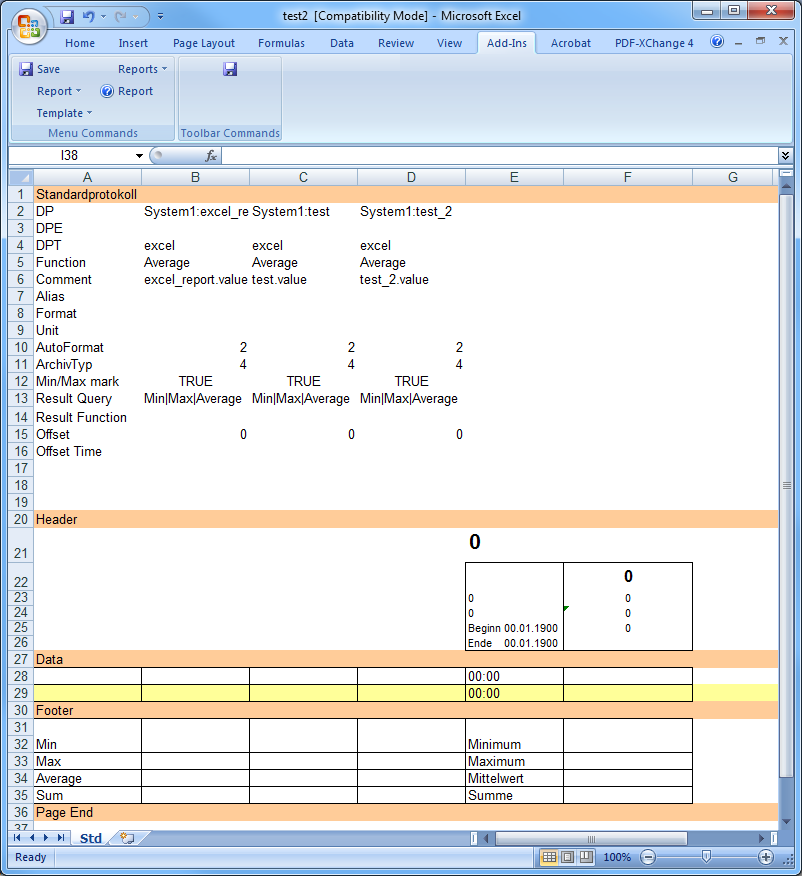
A template is structured into four different areas demarcated by orange rows or columns. The screenshot below illustrates a standard template.
The four areas are called:
-
Default settings, containing the report type, for example, standard report
-
Data(Data area)
-
Page Endor Footer
The code words (located in column 'A' in the standard report, and in row '1' in the ATV report and operational report) and the orange demarcation rows must not be deleted or modified.
The template areas
A brief description of the structure that applies to all report types is given below. The following applies to all areas:
Default settings
T he information on each of the data points is saved in the first area (Settings). This section is normally not visible in the finished report.
You must not add or delete rows in this area! Only experienced users should edit these rows if necessary when creating a template.
You can find more details in the Data analysis chapter.
Header and Footer areas
The Header and Footer areas can be customized using the MS Excel functions (but you cannot change the headers and footers of Excel itself).
If these rows are meant to appear on every sheet of a multi-sheet report, then this must be set under the menu option Page setup/Tablesheet/Rows to repeat.
See the following examples:
-
an Example of a standard template under "Structure of templates".
Data point columns
Simple Excel formulas are used to transfer suitable titles for the data point columns from the settings area (between Report type name and Header).
For example, in the Example of the standard template shown above , the formula "=C6" appears in the cell C21 so that the comment text " Dry weather pump 1" from row no.6, column C will appear in the heading row no. 21, column C.
Code words
Code words can be entered in the header area and the footer area in order to display statistical functions (e.g. in column 'A' of the Standard report ). The relevant values are then entered here for each data point. The following code words can be used (see _dp_fct):
Min, Max, MinTime, MaxTime, Number, Sum, Integral0, Integral1, SumNumber,
                    Average, Average1, Time0, Time1, Changes, Changes01, Changes10, StartValue,
                    EndValue and Difference
WinCC OA functions in Excel
Several code words are available to the user for labeling the finished report in the header and footer areas or in other areas outside the actual data area. You can choose to access the report information in all templates by German or English names. (erProtokollTyp = erReportType).
| WinCC OA function in Excel | english name | Description of function |
|---|---|---|
| erProtokollTyp | erReportType | Name of the report type |
| erVon | erFrom | Start time of query |
| erBis | erTo | End time of query |
| erIntervall | erInterval | Time interval between the individual values |
| erIntervallEinheit | erIntervalUnit | Units for the time interval between the individual values |
| erPeriode | erPeriod | Period of time covered by the report query |
| erPeriodeEinheit | erPeriodUnit | Units for the period of time covered by the report query |
| erRequestType | erRequestType |
Name of the query type. There are three different types how a report can be created: Man: manually created report, Time: time controlled, WinCC OA: triggered through WinCC OA |
| erUserName | erUserName | The user name. Specifies who created a report. |
These code words are used like functions in Excel (must be called from a cell using, for example, =erFrom). One thing to ensure here is that the corresponding cells also have the correct display format, as shown in the following example:
 Example
| For this formula: | Cell formatting required: Format _ Cells _ Numbers |
| Formula erFrom | Date _ '4.7.97 13:30' |
Data area (Data)
The Data area can be defined using one or more rows which will contain the individual values for the data points over time. These rows are used cyclically in the report layout. For example, if the parameter setter creates a template in which one white row, one green row and one yellow row are displayed in its three-row data area, then in the finished report this color sequence will be repeated cyclically as many times as is necessary to display all the rows of values.
In the template for a daily report containing hourly values, 24 rows do not need to be allocated in the data area. WinCC OA Excel Report automatically fits in the necessary number of rows when the report is created.
You customize the formatting. Formulas can be inserted in columns where no data point has been defined. Mixed queries across several systems can be compiled in one joint report.
Reports are protected with Sheet protection by default. This means that subsequent changes to individual cells cannot be made. If you want to exclude individual cells from this protection, then disable the Locked option via Home/Format/Format cells/Protection. This might be useful for instance in comment columns.


