Node-RED - Example Flows
WinCC OA provides 7 Example Flows that showcase the use of the WinCC OA Nodes:
Default Server
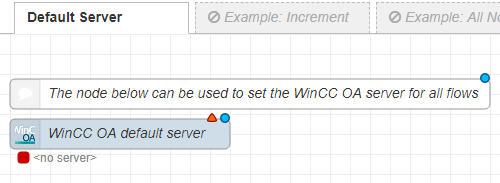
The Default Server Example is not strictly an example flow, but defines a WinCC OA Global Server to be used within all example flows. This server should be configured to simplify the work with the example flows.
Increment
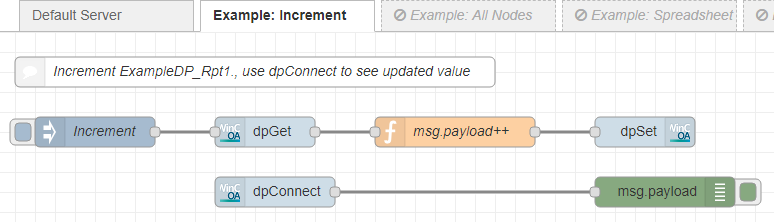
The "increment" example places an inject node to input an incremental value change. The dpGet node retrieves the current value of the datapoint from the server. Then the value is incremented by 1 in the function node and set to the same datapoint with the dpSet node.
The dpConnect node is connected to the datapoint and will display the value-change with the debug node.
All Nodes
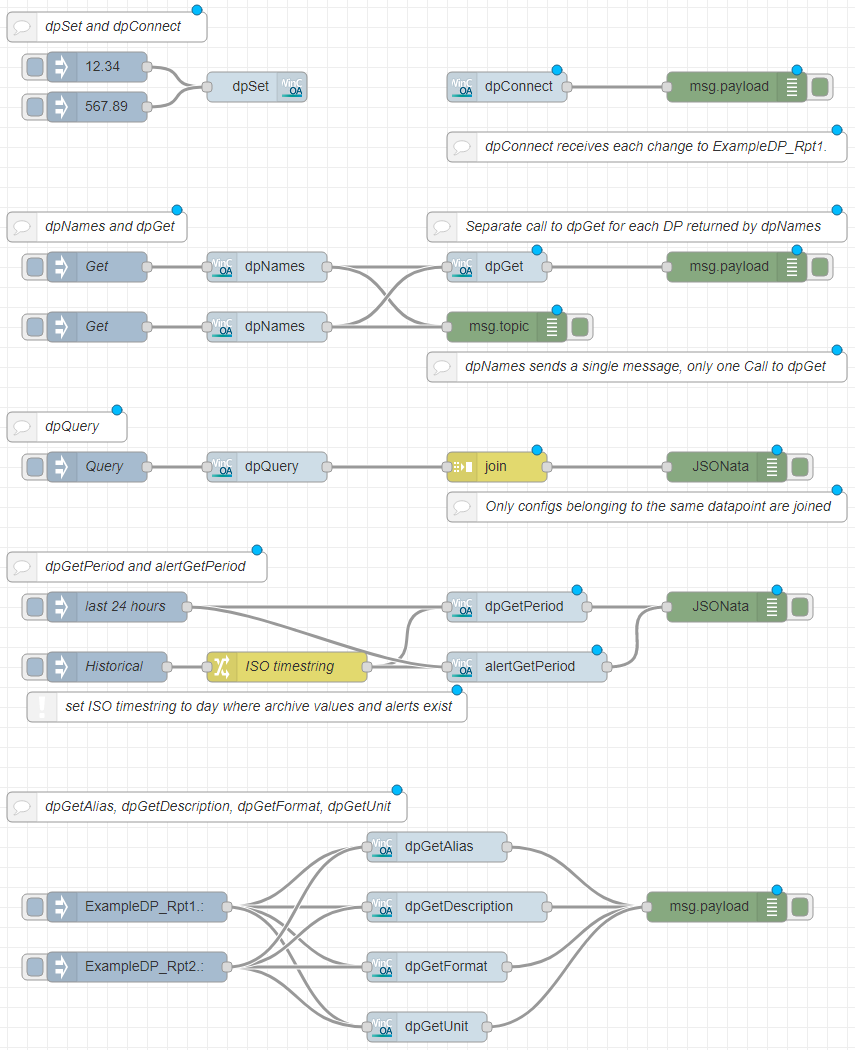
The all nodes example provides small examples showcasing all WinCC OA nodes.
The first part uses a dpSet node to write the input coming from an inject node to the datapoint. The dpConnect behind the dpSet node is triggered when that datapoint value changes. It passes the current value as a message to be displayed by the debug node.
In the second part, one of the inject nodes triggers the retrieval of datapoint addresses matching the pattern given in the dpNames nodes. From there the list of datapoint addresses is sent to a debug node and to a dpGet node to retrieve all datapoint values. This example showcases the use of the "Single output message" property, as only one of the dpNames nodes uses it. Triggering the lower node will result in a single output message and thus a single dpSet. The upper dpNames node will send a separate message for every matching datapoint, thus triggering a separate dpSet for each. The single dpSet is much more efficient than the repeated calls.
The third part triggers a dpQuery. The query will send individual messages for each datapoint element value selected by it. Individual messages belonging to the same datapoint element are grouped into one message. Then the messages are displayed with the debug node.
The fourth part uses both dpGetPeriod and alertGetPeriod. The upper inject node triggers a call for the last 24 hour period. The lower node passes its message into the change-node, where a static timestamp is set. The timestamp is used to set the interval used by dpGetPeriod and alertGetPeriod. The value changes and alerts will then be displayed with their timestamp. For alerts, each message will be passed to the output in the language defined in the locale property. In case there is no language defined, the project default language is used.
The fifth and last part uses the remaining variants of dpGet. The inject nodes pass the datapoint as a message topic. The dpGetAlias node retrieves the datapoint alias and passes it straight to the debug node. The dpGetDescription, dpGetFormat and dpGetUnit nodes retrieve a Description, a Format and a Unit, in the language specified in the locale property in their server configuration. If no language is selected, the project default language will be used. All informations are then passed to the output node that displays the text in the log.
Spreadsheet
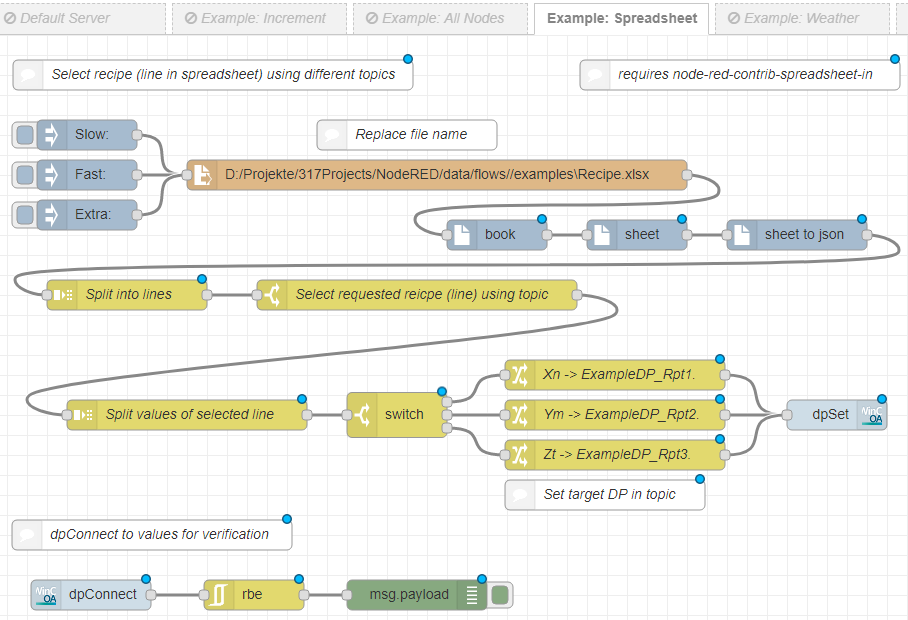
This example extracts a recipe line from a spreadsheet and sets the values contained therein to datapoints. The nodeRED node "file in" is needed to read the spreadsheet. The nodes "book", "sheet" and "sheet to Json" are included in "node-red-contrib-spreadsheet-in", which has to be installed (e.g.: in the Editor with "Manage Palette").
The inject nodes input the topic and trigger the read process. After the file is read in, the "book", "sheet" and "sheet to json" nodes convert the spreadsheet to a json object. The object is then split into lines. One of the lines is selected on basis of the topic specified as input. The selected line is then split into the different values, which are sent into their respective datapoints by switching the topic to the datapoint and using the dpSet node.
Weather
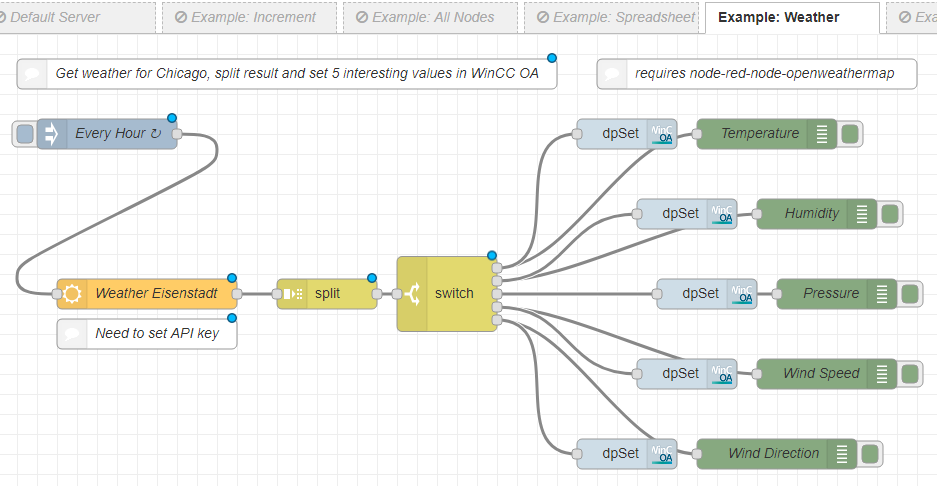
Every hour, the current weather in Chicago is checked, split into specific components and sent to the corresponding datapoints. For this example the nodeRED node "openweathermap" is required. This node is included in the "node-red-node-openweathermap", which has to be installed (e.g.: in the palette section of the Editor with "Manage Palette"). Additionally an API-key has to be downloaded from the OpenWeatherMap web page.
An input from the inject node triggers the process. The current weather is checked on the OpenWeatherMap web page. The retrieved information is split into different messages in the split node. The switch node then sends out the separate messages according to their payload. The messages are shown in the debug and their values set to the datapoints with dpSet nodes.
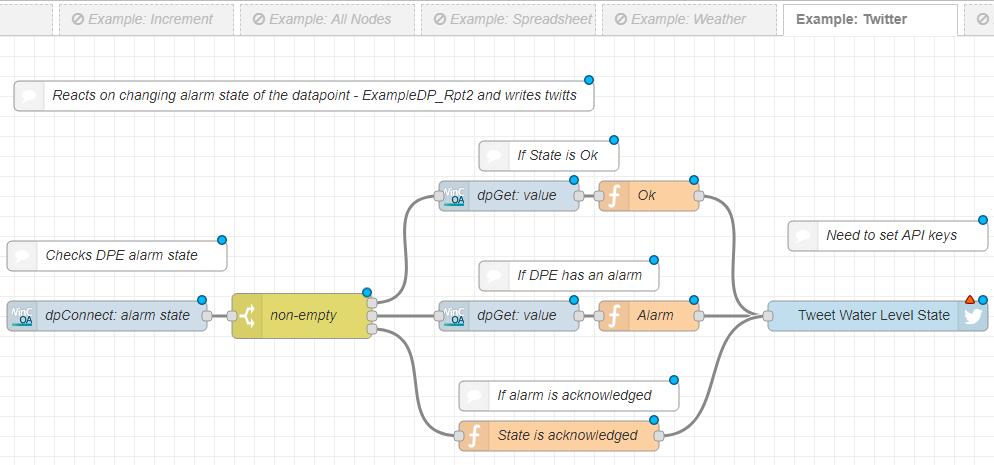
This example creates a connection to a datapoint and then posts a tweet about the current alert state. To enable the usage of this example valid twitter credentials need to be entered.
The dpConnect node connects to a datapoint elements alert state and sends an output whenever the value changes. This message can be either no alert, an active alert or an acknowledged alert. If an alert was not triggered, the current value of the datapoint is retrieved and added to a message confirming the good state. An active alert adds the current value to a message alerting the user of too high water levels. An acknowledged alert results in a message containing the resolution of the alert. The message is then tweeted with the twitter output node.
Energy

This example simulates a production line and monitors its power consumption as well as the resulting energy costs. The Node-RED node "power monitor" is used. This node is included in the "node-red-contrib-power-monitor", which has to be installed (e.g.: in the palette section of the Editor with "Manage Palette").
The three inject nodes provide the simulation of a production line. They are used to send the different payloads to the connected datapoint, depending on the selected state. This triggers the dpConnect to the same datapoint. From there the power monitor triggers the retrieval of the current energy price and passes the consumption value to a function and a template node. The retrieved price is sent to another template node and to the function. The function calculates the overall price for the current consumption from the usage and the industrial price. The two template nodes set their information as parts of a message. The resulting data is then displayed in the console.
dpConnect
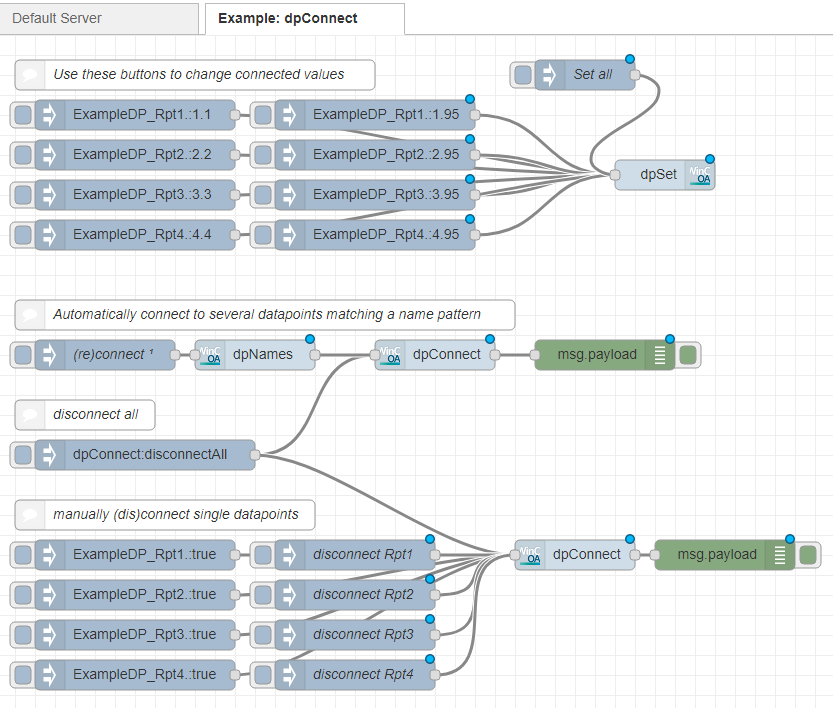
This example highlights the use of the dpConnect node by showing different ways to connect and disconnect datapoints to the dpConnect node.
The first part of this example provides different inject nodes, which will each send a message to the dpSet node. They are used to set the given values to the four datapoints the dpConnect nodes will connect to.
In the second part of the example, an inject node triggers the dpNames node, which will provide a single output message containing all datapoints that match the given pattern. The dpConnect node will then connect to the datapoints contained in the message. If one of the datapoint values is changed, the dpConnect node will send a message containing the datapoint address and the new value to the output node to be displayed in the debug.
The second and third parts of this example share an inject node, which will send the message "dpConnect:disconnectAll" to terminate all datapoint connections. Additionally, the property "Separate connection for each datapoint" is activated for both dpConnect nodes, ensuring they will send a separate message for each changed datapoint.
In the third part of the example, two inject nodes are associated with each datapoint. One inject node will send a message containing the datapoint address to the dpConnect node, which will establish a connection to this datapoint. The other inject node will send a message containing "dpConnect:disconnect", to disconnect this datapoint. If the value on the connected datapoints change, or a new connection is established, the current value will be displayed in the debug via the output node.


