Gantt Chart Widget
The Gantt Chart provides a time-interval view of the data point value. The width of each bar shows the period a certain value was present.
Datatypes
| Datatype | Supported? |
|---|---|
| int | ✓ |
| uint | ✓ |
| float | ✓ |
| long | ✓ |
| ulong | ✓ |
| string | ✓ |
| char | ✓ |
| bool | ✓ |
Settings
Each separate line of bars represents one series.
Multiple series can be set to different data point values. Every series is controlled via a mapping of values and associated information.
The settings defined in this mapping are the value ("key") the datapoint has to reach, the associated "name" and "description" as well as the "color" which will be shown. If no entry was set for a specific value, the default key will be used. The default is generated automatically and will be present in every mapping.
The displayed time range can be adjusted to any of the predefined ranges. To make this range adjustable in the view mode, the "range selector changeable" check box must be checked. The tooltip can be activated and deactivated.
Grids can be set to appear along the time or y axis with the respective check boxes. A legend for the data point series and the selected mapping can be placed in a variable position on the sides of the graph. The data zoom settings determine if a zoom along the time axis is possible. Additionally the angle for the time axis labels can be adjusted.
Widget View Configurations
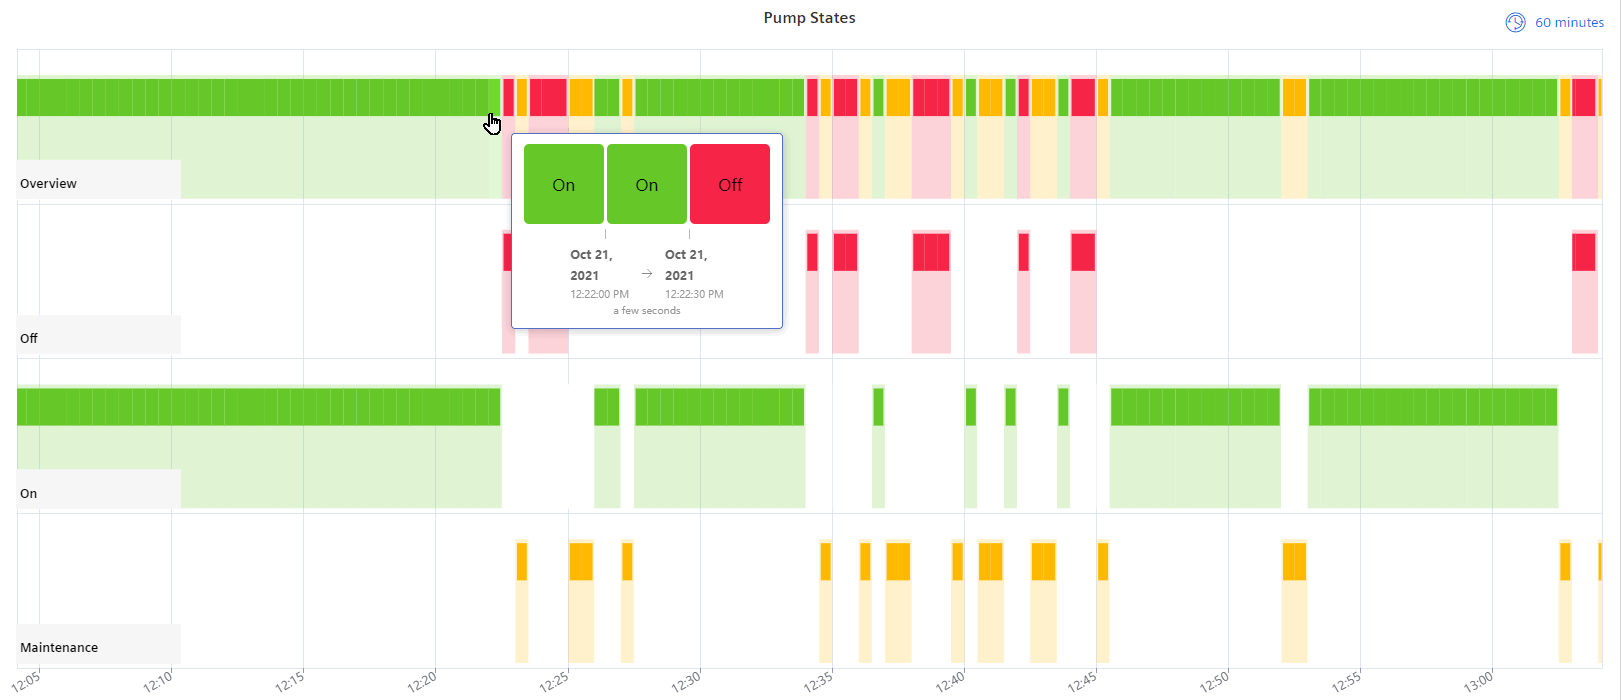
Within the standard Dashboard view, the tooltip for the widget will provide the currently selected value, as well as the values before
and after this. This is done in the format before < curent > after. Additional information about how long the
currently selected value has been present on the datapoint is provided below.


