Dashboard
The WinCC OA Dashboard offers an easy, mobile way to create personalized web displays, making visualizing the state of projects quick and simple.
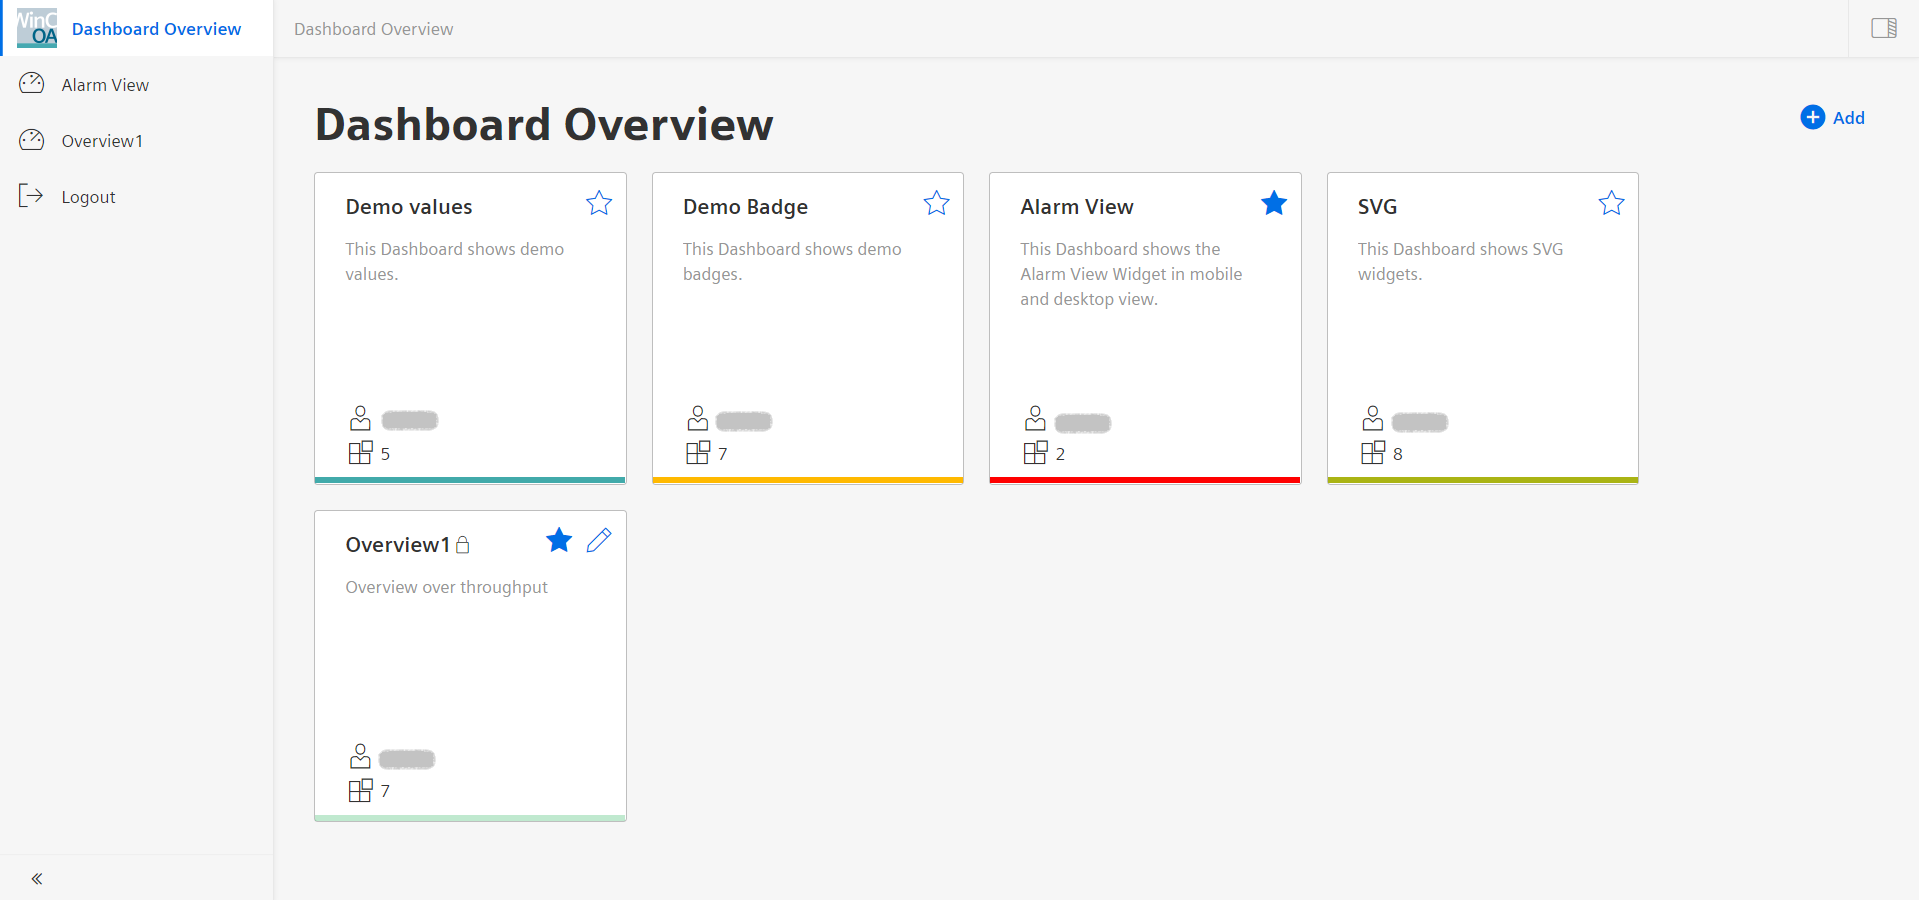
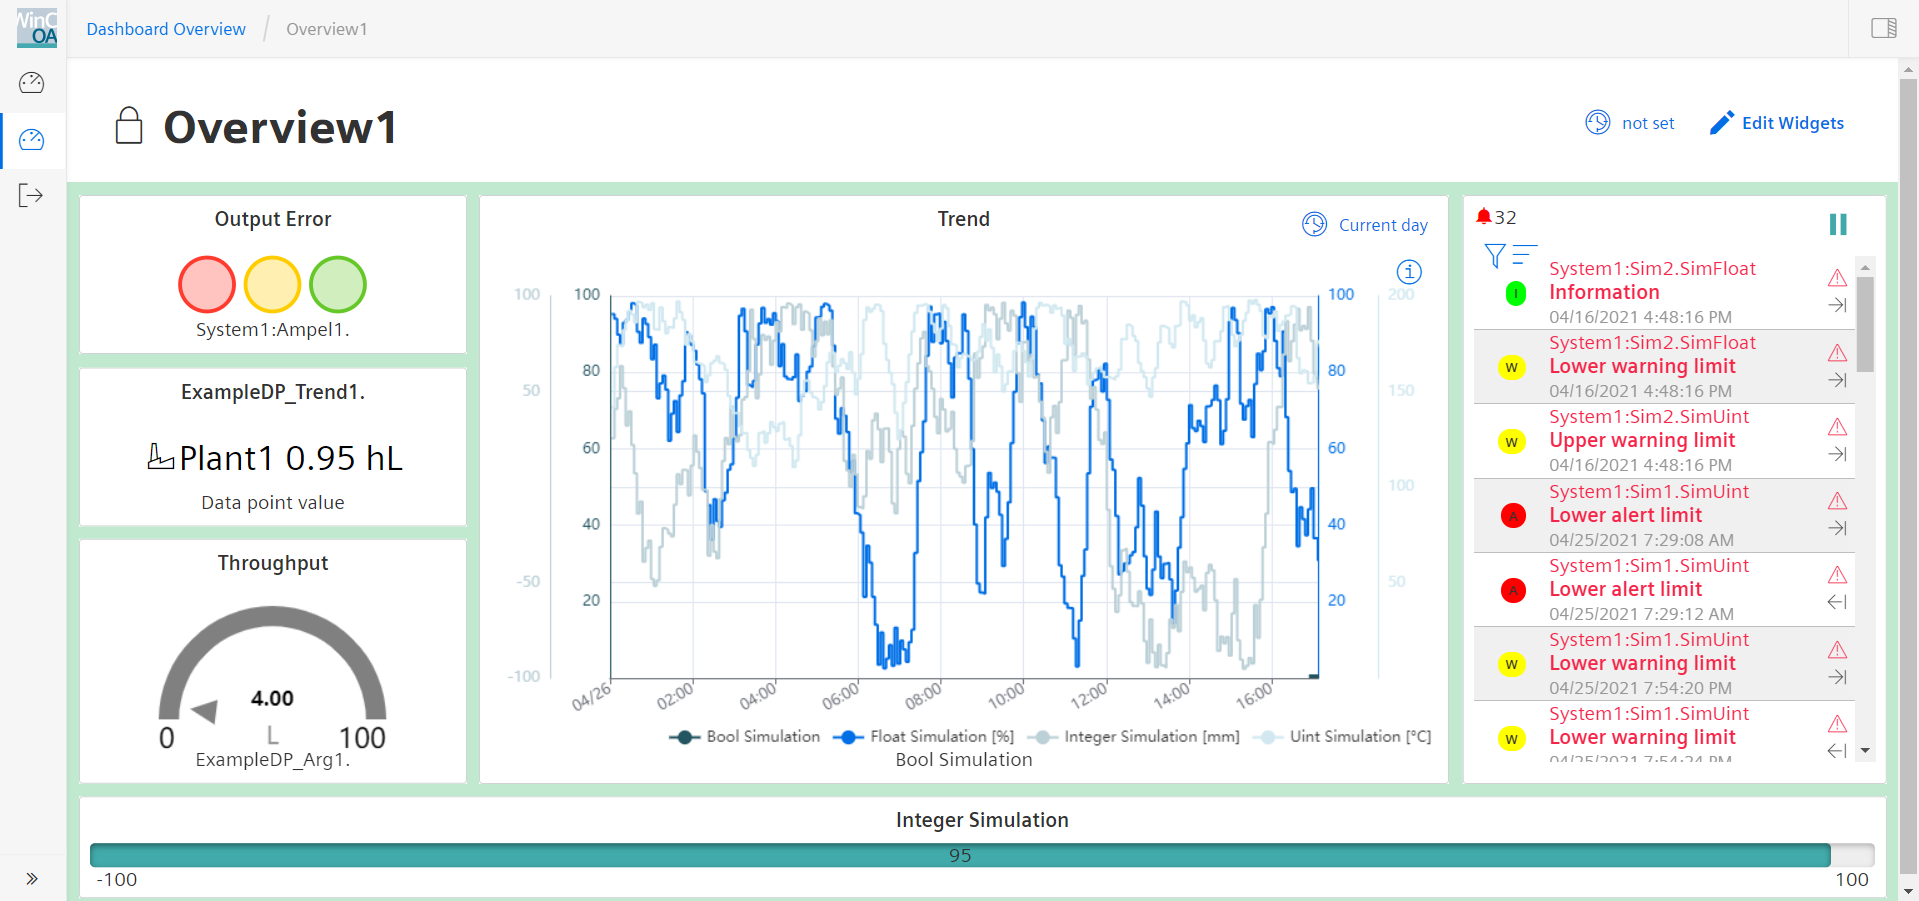
Extensively modifiable widgets connected to data points can be used to display data values in a number of different graphs. Combining these widgets creates specific dashboards. Navigating between dashboards can be done easily via the Dashboard Overview.
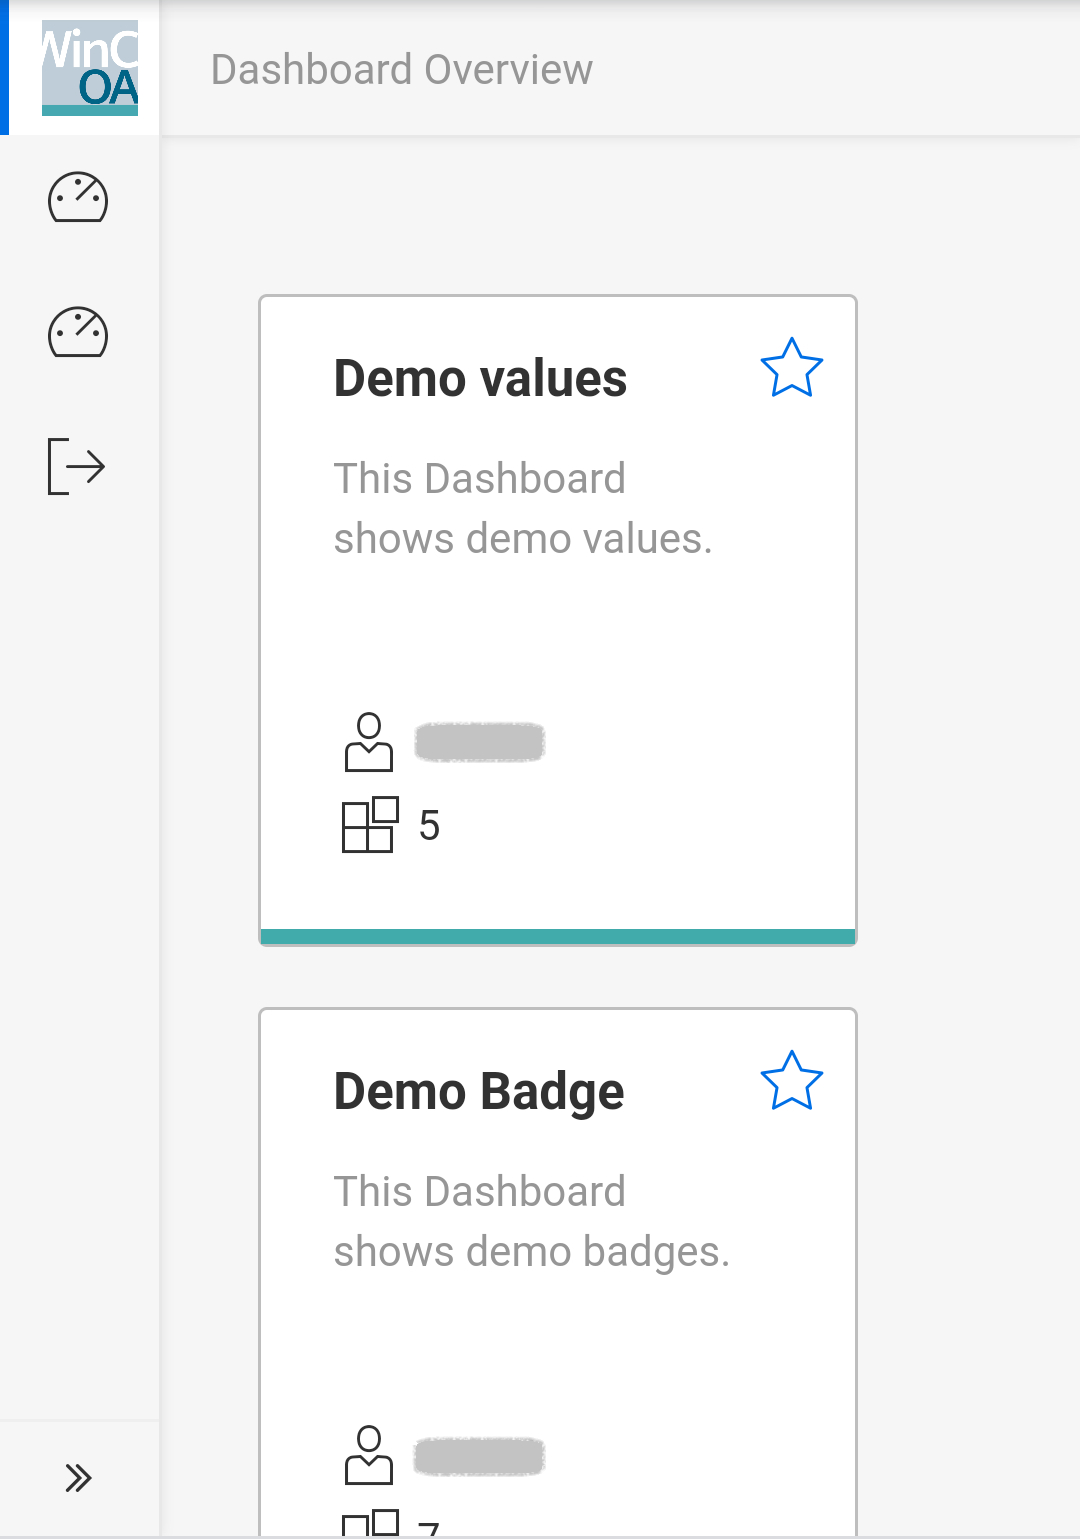
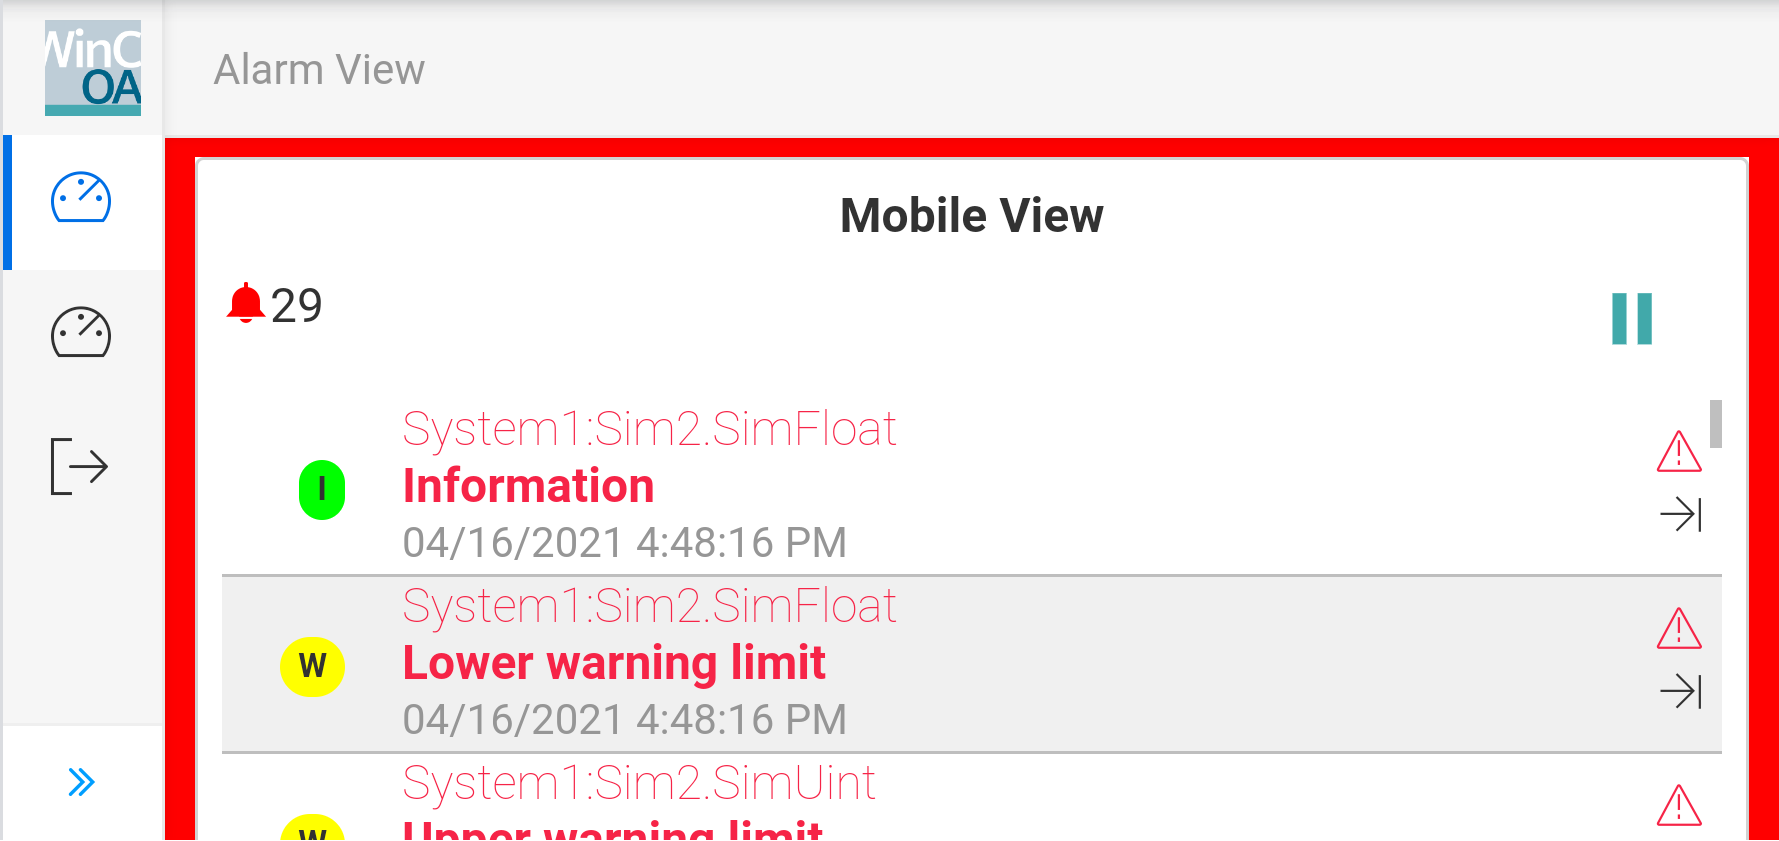
The Dashboard is angular-based and connects to WinCC OA via an HTTP Server. Thus it can be opened in all supported browsers, both on desktop and mobile devices.