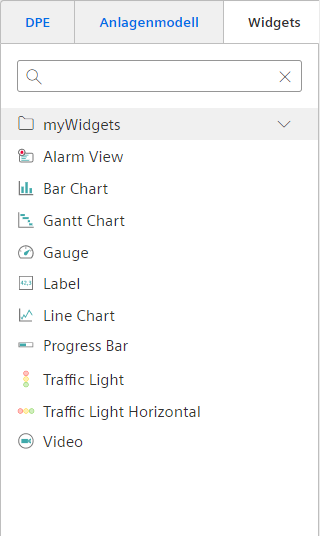
Widgets
There are different types of Widgets, which can be combined to create individualized dashboards. It is also possible to add custom SVG widgets via the "add widget" menu or the project directory.
Some settings are equivalent for multiple widgets:
General Settings
Titles
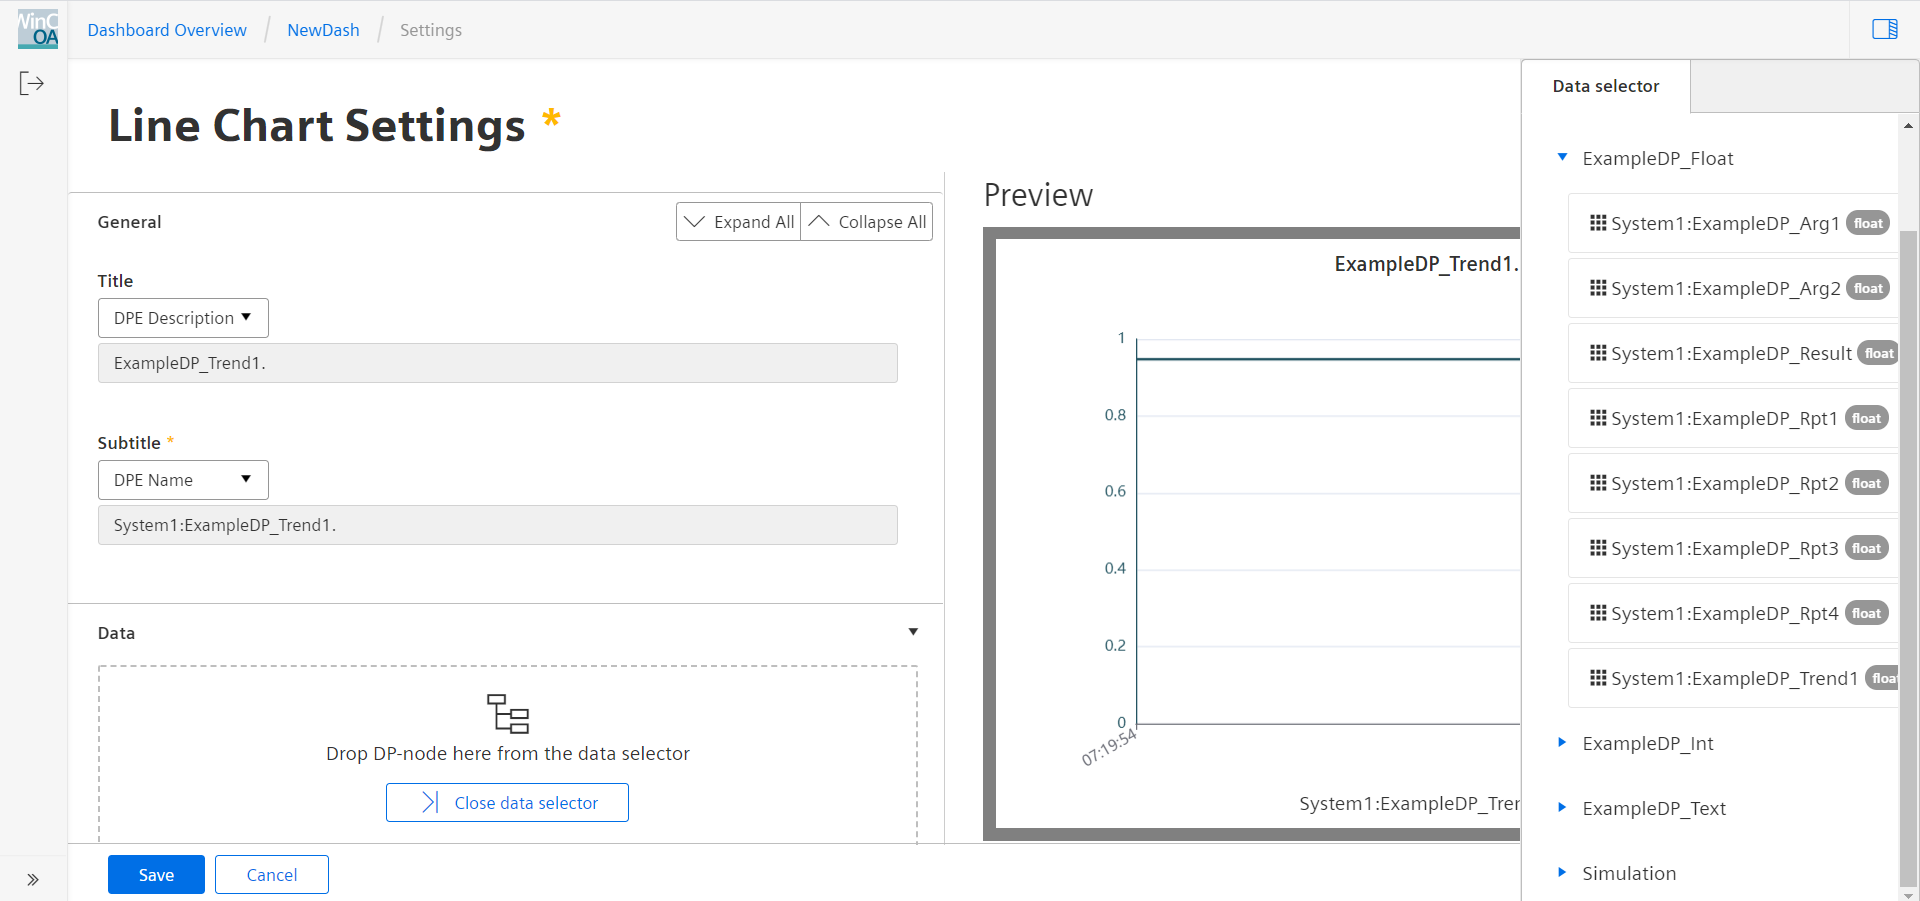
The title and subtitle displayed for the graph can either be set manually or taken from the data point. Via the drop-down list any of the associated descriptions or names in WinCC OA can be chosen. The title is displayed above the graph and the subtitle below it. Both custom titles can be added in all available project languages.
Custom CSS Styles
You can add custom CSS styles to the online Dashboard by adding a single customstyles.css file to the
/dashboard/ directory of your WinCC OA project.
Data Settings
Most widgets require a connection to a data point to function properly. The exceptions to this are the alert view and the label. Data points are added via drag & drop from the Data Selector. Each data point produces a separate series of values, which is displayed in the specific graph.
Alerts and other status information can be shown in the widget when the respective check box is activated. The information is shown either as colored badges in the top right corner of the widget or by applying the alert color in parts of the widget.


