Example of SmartSCADA
This chapter describes how to use SmartSCADA. This chapter contains a simple example. You can find an extensive example of SmartSCADA on the ETM portal: https://www.winccoa.com/downloads/category/demo-projects-1.html.
This example comprises the following issues:
- KPI Wizard: how to create KPIs (Key Performance Indicators)
- KPI Wizard: how to inspect your values (KPI result)
- Data Mining Wizard: how to detect correlations between different indicators of your system
- Classification Wizard: how to create a random forest model
- Classification Wizard: how to evaluate the accuracy of your created model
- Classification Wizard: how to predict values
Requirements
In addition to the general requirements for SmartSCADA (see chapter Requirements and Installation), the following requirements must be met:
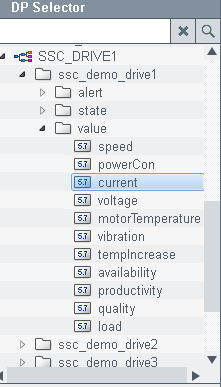
In this example a drive data point "ssc_demo_drive1" is used. This data point type was created for this example and contains the elements "value.current" and ".value.voltage".
In order to display values, either use an already existing data point that already contains values or generate values for this data point by using a simulator. The easiest way to simulate values for a data point is to use a WinCC OA reference object such as RandSim of the STD_SIMULATOR symbols.
How to add a simulator to generate values:
- Open the graphics editor GEDI and create a new panel via Panel -> New panel.
- From the "View" menu, select the option "Catalogs" and the WinCC OA version. The catalog object list is shown in GEDI.
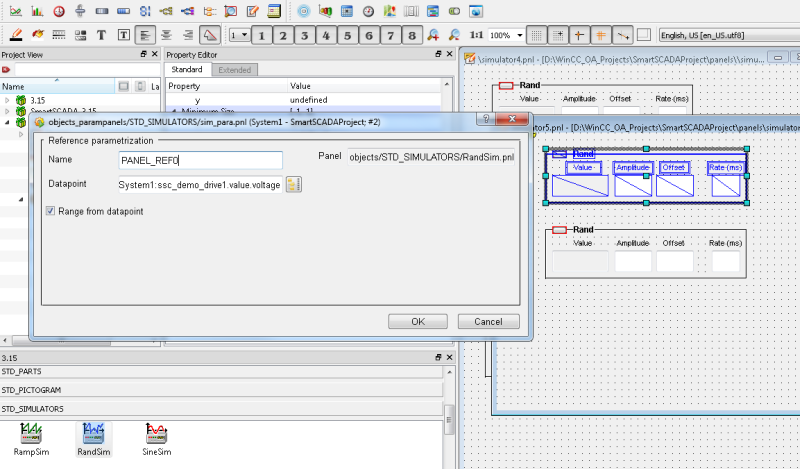
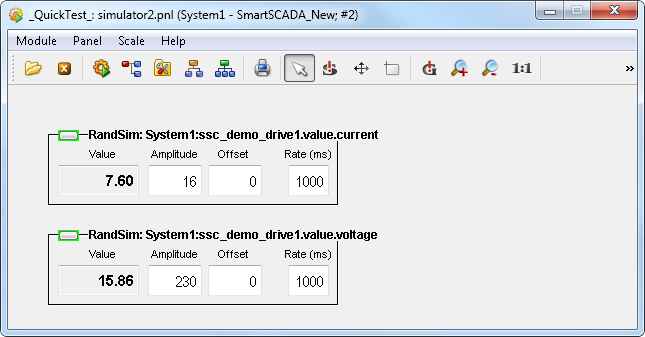
- Scroll down to the STD_SIMULATORS symbols and select the object "RandSim" by dragging and dropping it to your panel. The panel for the data point selection is automatically opened. Click on the PARA button and select the data point element "ssc_demo_drive1.value.current". Click on "Save" in the GEDI and open the panel via the WinCC OA console or via the Quick Test Module of the GEDI. Set the value range for the simulation and set it to active. Now values are generated for the data point "ssc_demo_drive1.value.current". Repeat the step to generate values for the data point "ssc_demo_drive1.value.voltage". You can also just copy the simulator in the GEDI and then change the data point in the data point selection panel. Now you are ready to take a look at SmartSCADA.
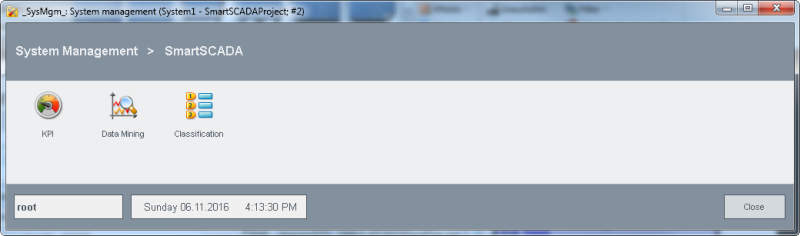
All SmartSCADA wizards can be opened via the System Management panel -> SmartSCADA:
KPI Wizard
Open the KPI wizard and the Definition panel:
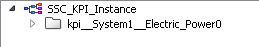
Create a KPI definition "Electric_Power". The example comprises an electric drive with current and voltage to calculate power. To create a KPI instance, a KPI definition must already exist. This example shows how to create a new KPI and attach it to the process image. For this example a drives data point type as shown in the figure at the beginning of this chapter must exist.
-
Create a KPI definition via the Definition panel. Create a new KPI definition type, for example, "Electric_Power" in the Definition panel. Enter the name "Electric_Power" to the "Enter new KPI definition" text field and click the plus sign
 (see figures below).Note:The name of the KPI definition must correspond to the WinCC OA DP name guidelines! See chapter Rename Data points for information on the name guidelines.
Figure 5. Create a new KPI Definition 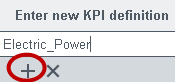
- Enter the parameters "current" and "voltage" into the "Enter new KPI parameter" text field and click the
symbol or press Enter.
Figure 6. Add KPI parameters 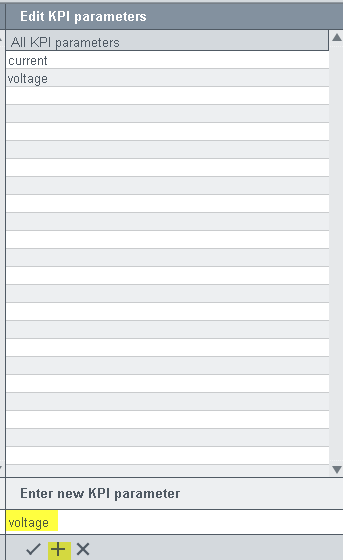
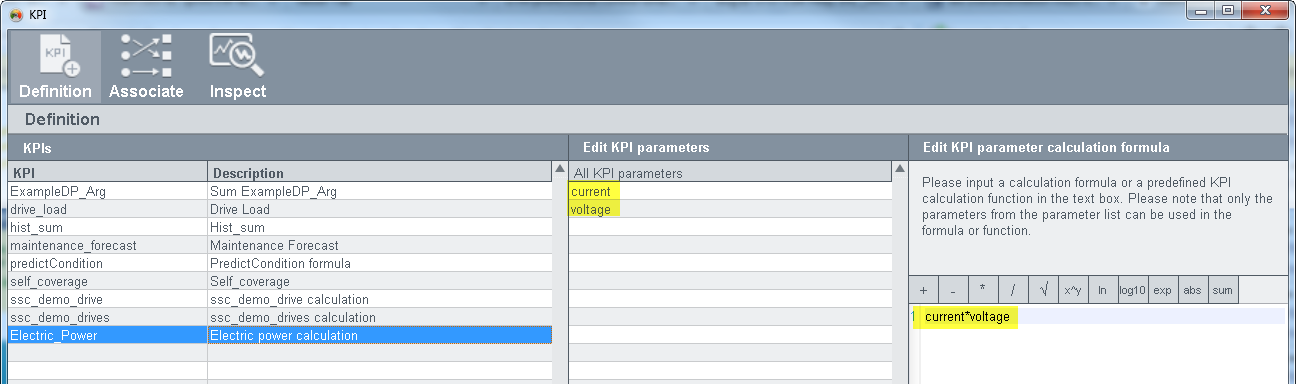
- Enter the calculation formula "current* voltage" into the text area "Edit KPI parameter calculation formula" (see
figure below) by typing or dragging and dropping the parameters from "Edit KPI parameters" table to the "Edit KPI
parameter calculation formula" text field.
Figure 7. Edit KPI parameter calculation formula 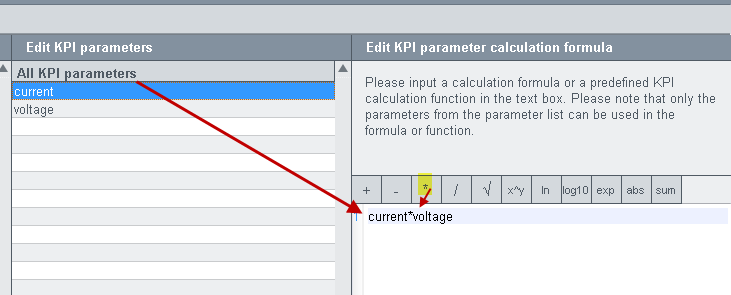 Note:When using a function call from the wincc_oa_path/SmartSCADA_3.15/scripts/libs/SmartSCADA/kpi/kpiFunctions.ctl this function must return a value.
 - In the Associate panel select the KPI type "Electric_Power" from
the "KPI Type" combo box:
Figure 8. KPI Type Combo box 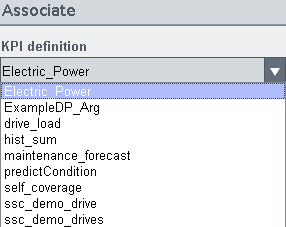
- Drag and drop the current element of the data point "ssc_demo_drive1" from the Data selection PARA window to the current
text field (see figure below). Repeat the step for the voltage parameter and drag the voltage element of the "ssc_demo_drive1"
data point to the voltage value text field. This example shows how to create a single KPI instance with directly attached DPE
addresses and no context.
Figure 9. Drag and Drop a Data point 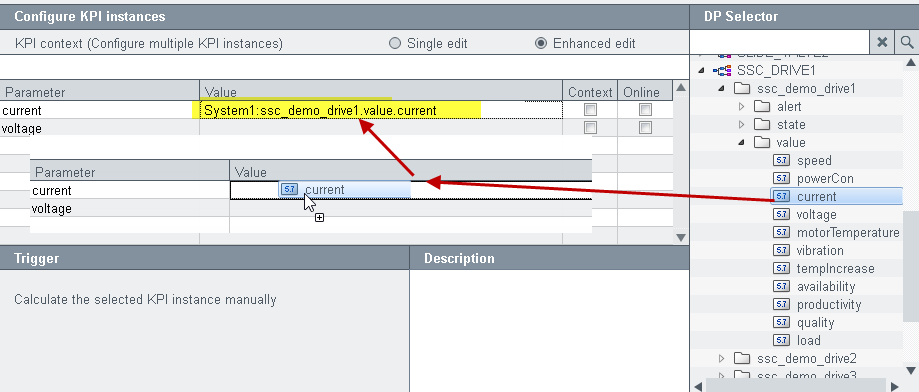
- Check the check box "Online".
Figure 10. Check the Check box 
- Activate the radio button "Online value" and select the trigger "current" from the "Select online trigger"
combo box and save the KPI instance. A KPI is calculated when a value is entered into the "current" data point element.
Figure 11. Create a KPI Instance 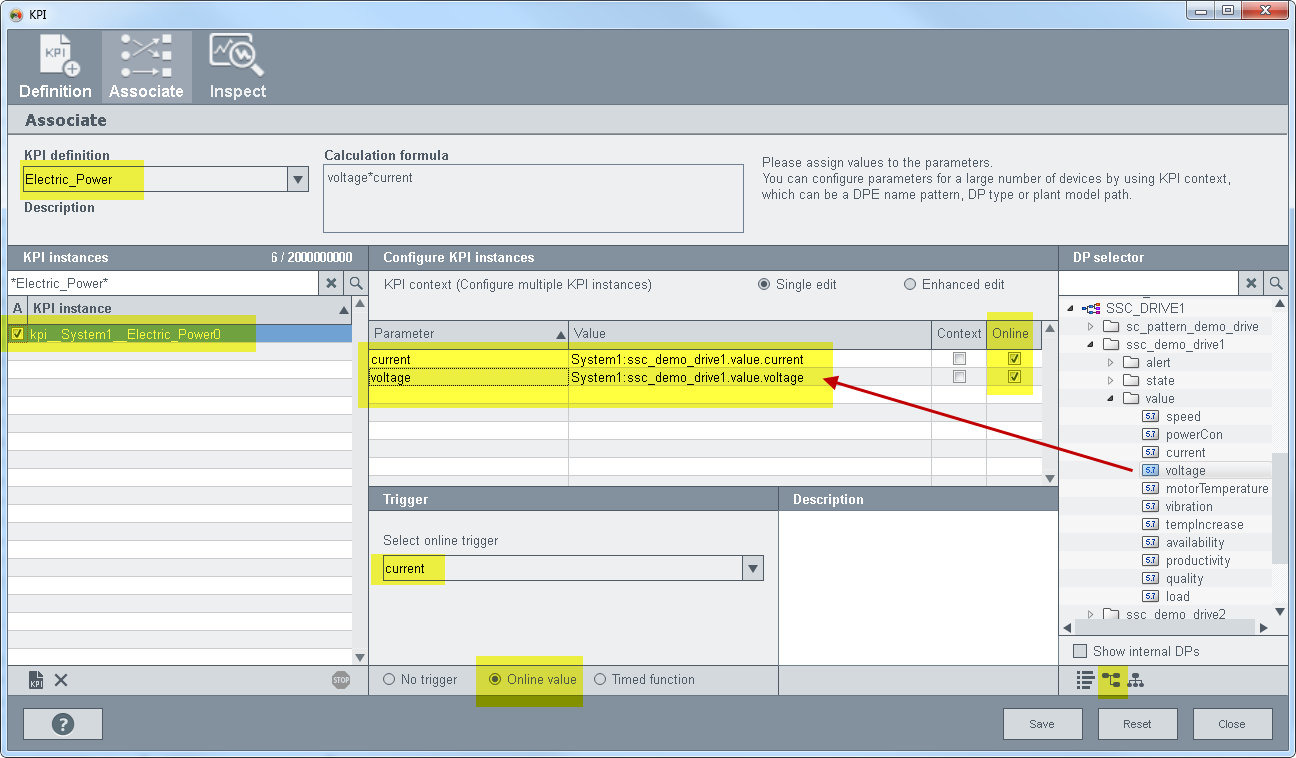
The KPI instance "kpi__System1__ElectricPower0" is saved in the Associate panel and a KPI instance data point is created.
Since the simulator generates values for the current and a voltage data points, the result of the calculation is saved in the result data point element of the KPI instance.
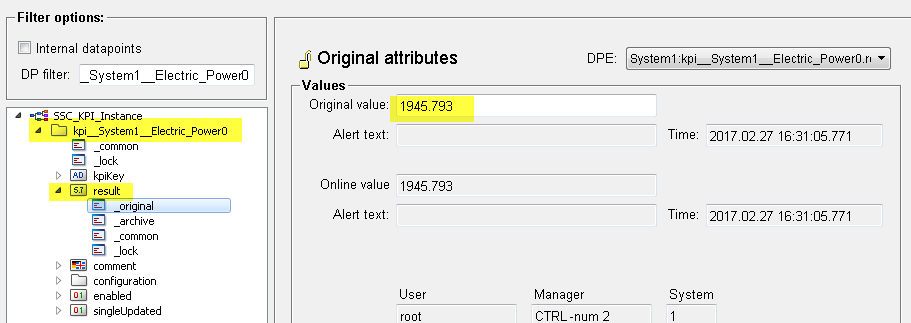
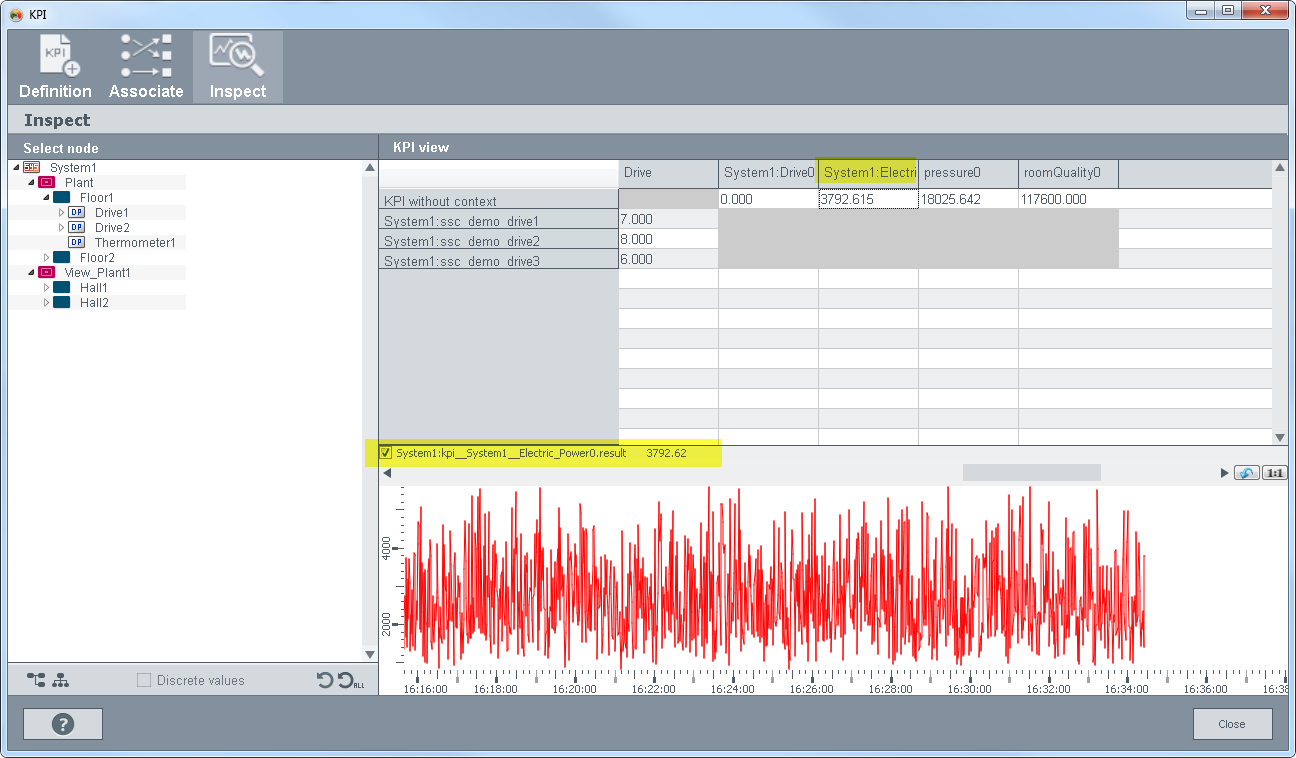
You can inspect the KPI result in the Inspect panel of the KPI wizard:
Data Mining wizard
Open the Data Mining wizard and the Selection panel:
- Create a new session "Example" by entering a name in the text field under "Create newsession" and by clicking
the + button.
Figure 15. Create a new session 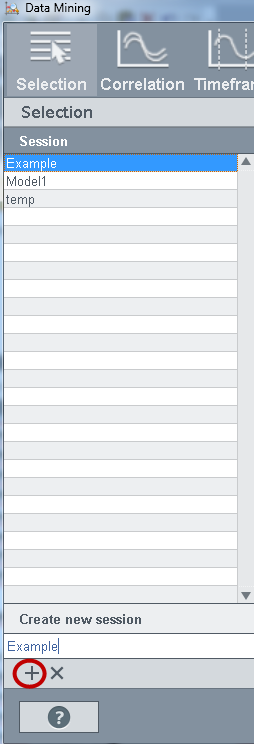
- Switch to the data point view on the right side of the panel and select the data points "ssc_demo_drive1.value.current",
"ssc_demo_drive1.value.voltage" by dragging the data points to the DPEs table.
Figure 16. Data Mining Wizard - Selection - Select data points 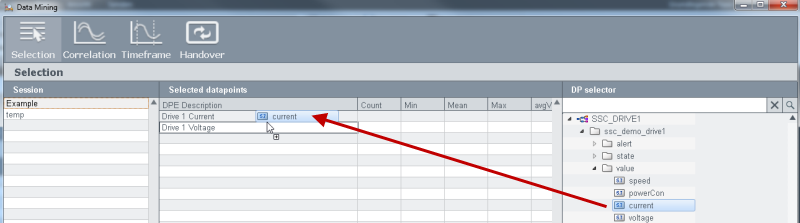
-
Select the time range, for example, the last hour or the current day from the "Time range" view. Check the check box "Equidistant time intervals" and set the time to 50 seconds. Check the check boxes "Enable lag detection" and "Calculate quality metrices". Save the session.
Figure 17. Data Mining Wizard - Settings for the session 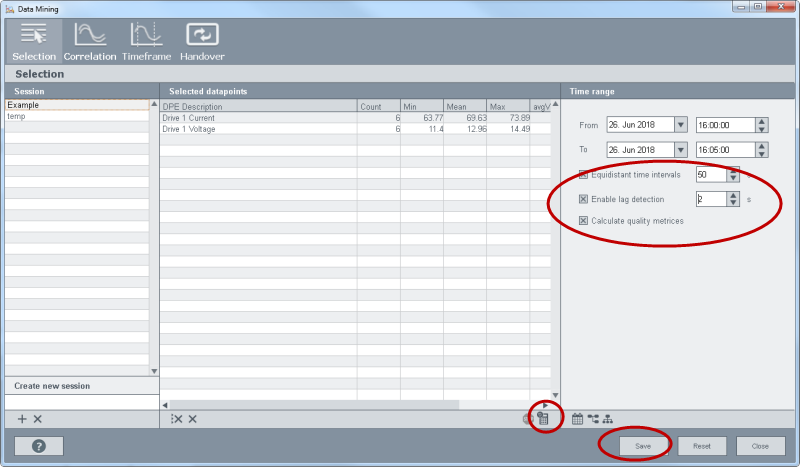
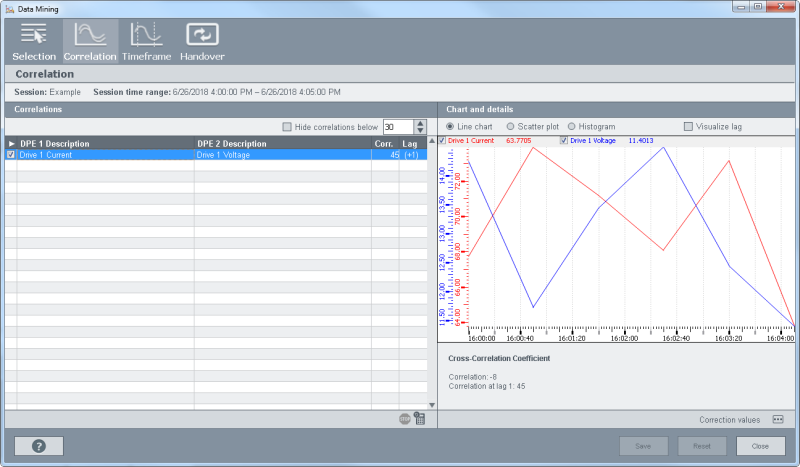
Open the Correlation panel:
- Check the check box for the DPE1 and DPE2 containing the data points. You can see the correlation coefficient in the table.
- Click the line and the data points are shown in a trend. You can switch the view to a scatter plot or to a histogram by using the radio buttons above the trend. You can also set correction values if needed by using the button below the trend.
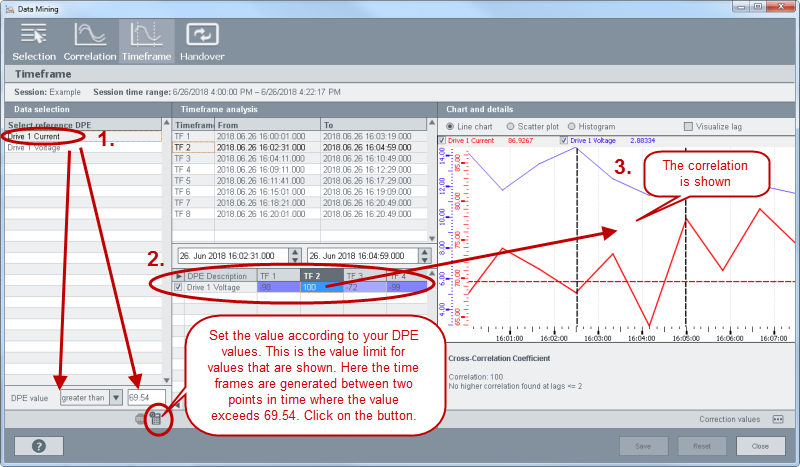
Open the Timeframe panel:
- The data points "ssc_demo_drive1.value.current", "ssc_demo_drive1.value.voltage" (or your selected data points) are shown in the "Select reference DPE" table. Select the reference DP "ssc_demo_drive1_value.current".
- Click the "Generate
Timeframes"
 button.
 - Time frames are generated for the time range that was selected and you can view the correlation for the time range by selecting the time frames from the Timeframe Analysis table (see figure Data Mining - Timeframe Panel below).
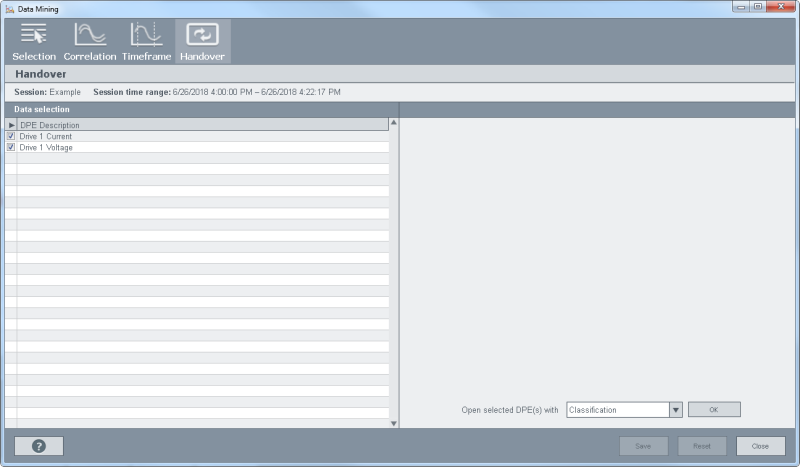
Open the Handover panel:
-
- Click on the OK button to open the DPEs in the Classification wizard in the Selection panel.
Classification wizard
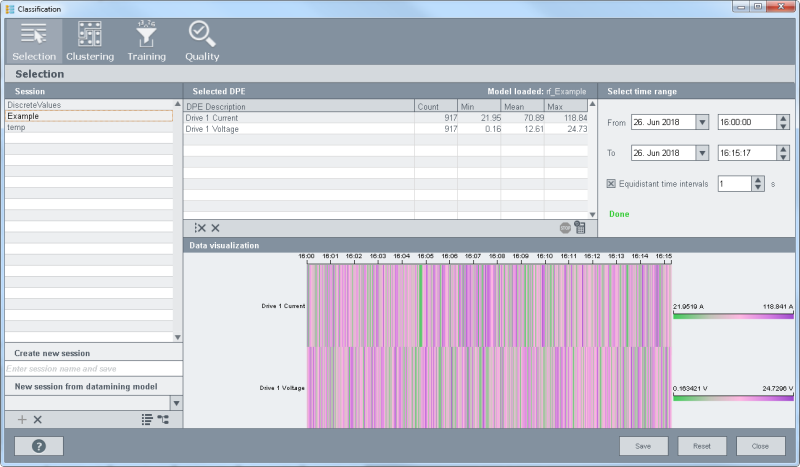
In theClassification wizard, the Selection panel is opened:
- The model and the data points are shown in the Selection panel. You can recognize value cumulations.
- Load the data by clicking the button
 below the "Select DPE" table.
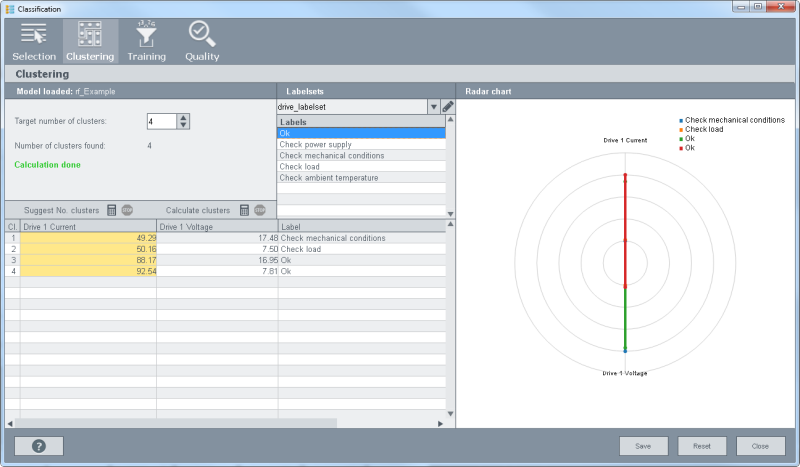
Open the Clustering panel:
- Set the number of clusters to 4 and click the "Calculate clusters" button.
- Create a labelset "DemoDrive1" or use existing labels and assign the labels to your values.
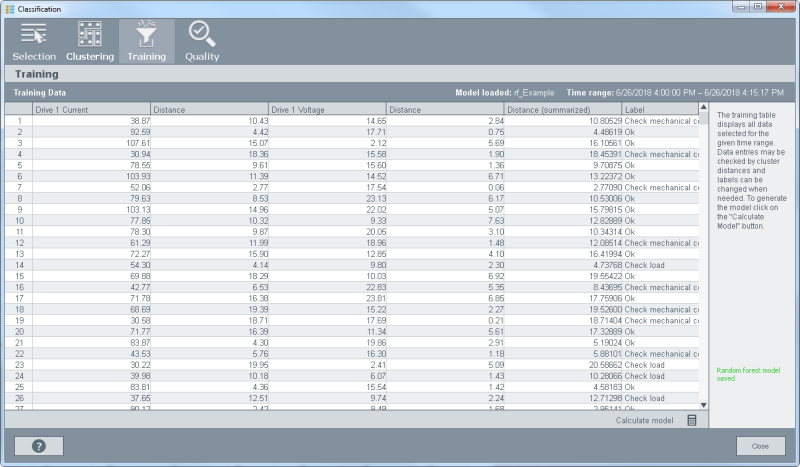
Open the Training panel:
- Click the "Calculate model" button to train the data of the random forest model.
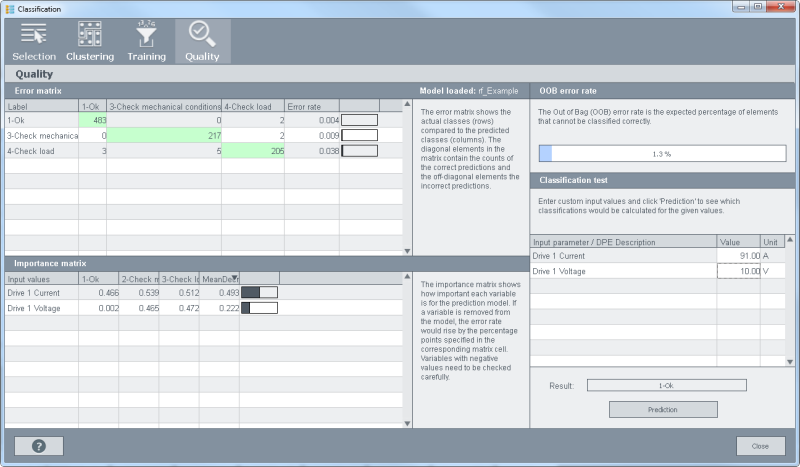
Open the Quality panel:
- In the Quality panel you can view the quality of your created model by using the Error and importance matrices. OOB error rate table shows the error rate of elements that cannot be classified correctly.
- You can also test values by entering the values into the "Value" field of the "Classification test" and by clicking the "Prediction" button. The result is shown in the field of the same name.