Data mining Wizard - Timeframe panel
In the "Timeframe" panel you can:
-
detect correlations between data points
-
analyze correlations at a specific time
The different parts of the "Timeframe" panel as well as how to use the Timeframe panel are described in more detail in the following.
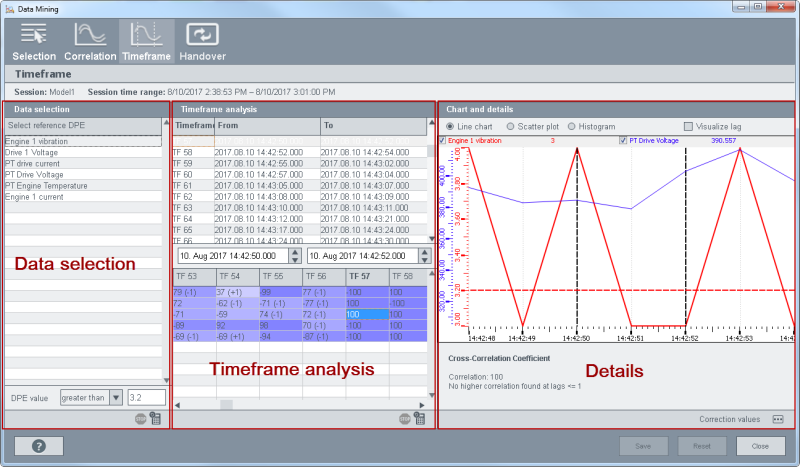
The "Timeframe" panel consists of the following parts: Data Selection, Timeframe analysis and Details
Data Selection
In the Timeframe Definition section, select the reference data point element, meaning the data point the other data points should be compared with. The "Select reference DPE" table displays all data points that were selected in the Session panel.
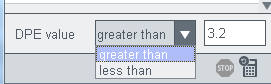 The spin button below the table allows you to
specify the threshold for the time frame. You could, for example, set the threshold
to greater than 3.2. This means that time frames are generated between two points in
time where the value exceeds 3.2. Vice versa the time frames can be generated
between two points in time where the value falls below 3.2 if you select the option
"less than"
The spin button below the table allows you to
specify the threshold for the time frame. You could, for example, set the threshold
to greater than 3.2. This means that time frames are generated between two points in
time where the value exceeds 3.2. Vice versa the time frames can be generated
between two points in time where the value falls below 3.2 if you select the option
"less than"
 Click the button with the Calculator
symbol to generate time frames for the "Timeframe Analysis" - see the
description below. Click the stop button to stop the generation of the time
frames.
Click the button with the Calculator
symbol to generate time frames for the "Timeframe Analysis" - see the
description below. Click the stop button to stop the generation of the time
frames.
Timeframe analysis
The Timeframe table contains the time frames that were generated via the button with the Calculator symbol. The table displays all time frames:
-
within the time range that was selected in the "Session" panel,
-
where the data point value between two points in time is greater than/less than the value specified via the spin button (see above) and
-
where a correlation between the reference data point (selected from the "Select reference DPE" table) and the other DPE (selected from the "DPE (correlation)" table) is found.
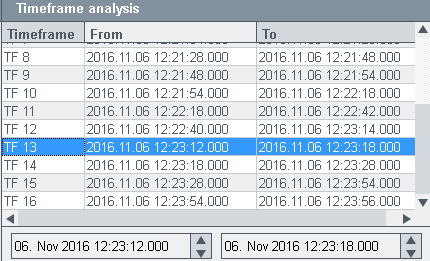
When you click a time frame, the time frame is selected from the trend view in the Details section. Vice versa you can also select a correlation from the correlation table below the Timeframe analysis window (see figure below). When you select a time frame, also correlation is selected from the other table and vice versa.
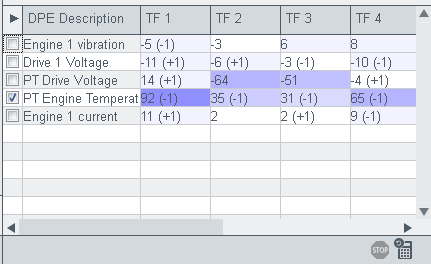
In the "Correlation" table (see figure above) the correlations are highlighted (white, two different shades of light purple and one shade of dark purple). The colors are shown at intervals of 10 in ascending order.
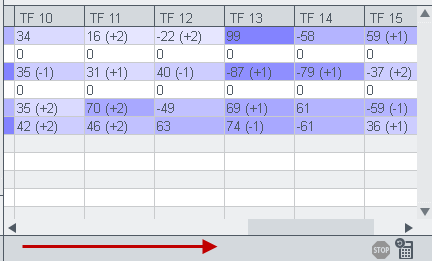
You can view all correlations via the horizontal scroll bar at the bottom of the window.
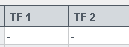
Note that minus sign (-) is shown in the correlation panel for errors meaning, for example, invalid parameter etc.
Figure: General error (no correlation result)
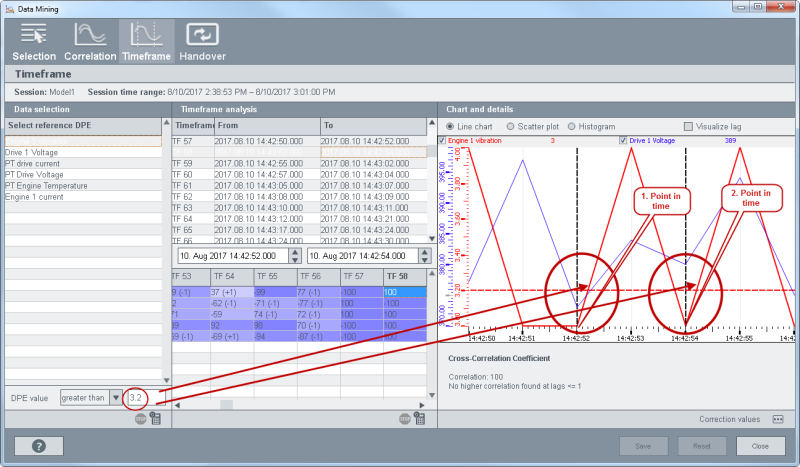
In the figure below you can see that the time frame with the correlation is selected from the Details trend view when you click the time frame or the correlation.
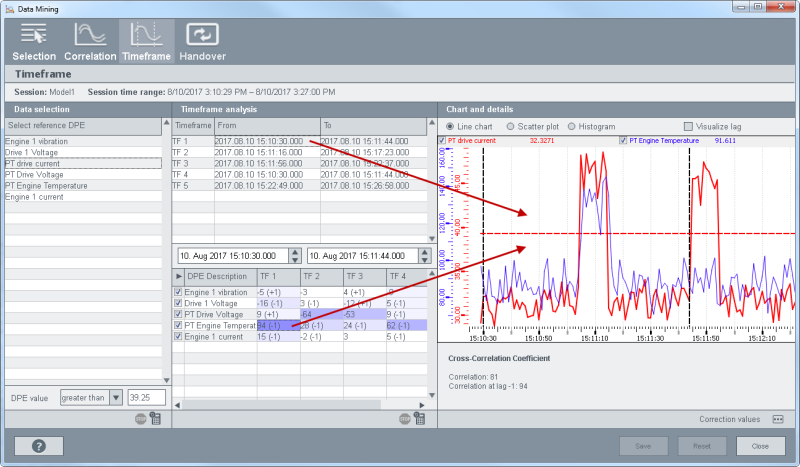
You can change the time of a time frame via the spin buttons and recalculate the
correlation for all the time frames via the button with the Calculator symbol . The stop button stops the calculation
of the correlation.
Details
The Details section provides a line chart, a scatter plot and a histogram. You can switch between the views via the radio buttons above the view. The details section contains the same options as the details section of the "Correlation" panel. For more information, see the description of the Correlation panel.


