KPI Wizard - Inspect
With the Inspect panel you can observe the state of your plant via the KPIs created via the KPI Wizard - Definition and KPI Wizard - Associate panels.
The different parts of the inspect panel as well as how to use the inspect panel are described in more detail in the following.
The following figure shows the Inspect panel:
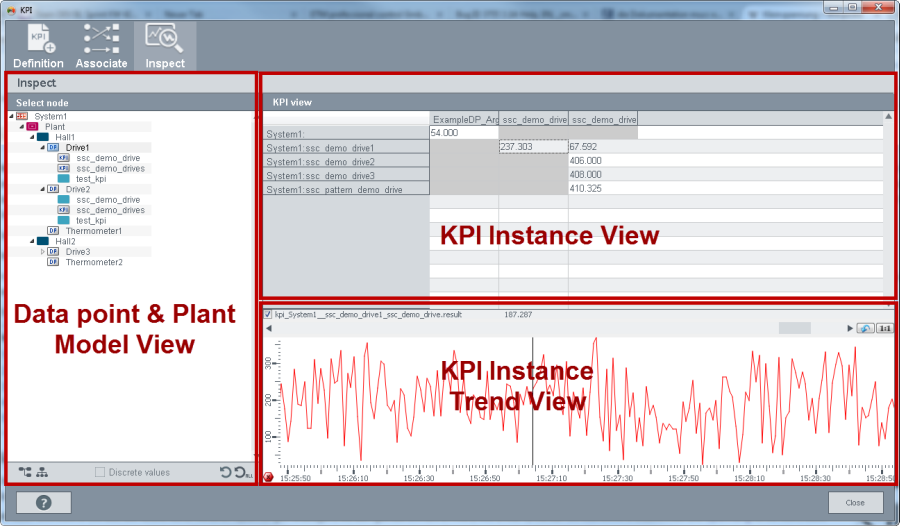
The panel consists of the following parts: Data point & Plant model View, KPI Instance View and KPI Instance Trend View
Data point & Plant model View
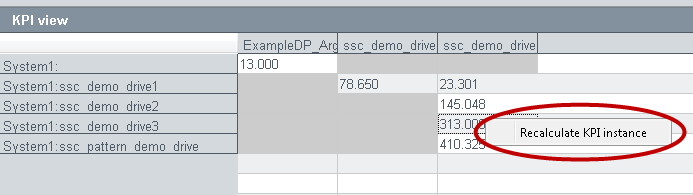
The PARA (data point view) shows the data points of the system. The plant model view displays the plant model tree. The buttons in the bottom bar allow you to switch between the PARA and plant module views and recalculate KPI instances:

 This button allows you to reload an instance. Note that
the instance is only reloaded but not recalculated. In order to recalculate a KPI
instance, select the instance from the KPI view and right-click on it. The
"Recalculate KPI instance" option is shown. Select the option and the KPI is
recalculated. Note that you only need this option if you selected the option "No
trigger" in the Associate panel.
This button allows you to reload an instance. Note that
the instance is only reloaded but not recalculated. In order to recalculate a KPI
instance, select the instance from the KPI view and right-click on it. The
"Recalculate KPI instance" option is shown. Select the option and the KPI is
recalculated. Note that you only need this option if you selected the option "No
trigger" in the Associate panel.
 This button allows you to reload all KPI instances.
 This button opens the PARA module
 This button opens the plant model view
 The Discrete Values check box is
only available when a KPI
Instance is based on the built-in ssc_predictCondition function and the
KPI instance is selected in the inspect
panel. The ssc_predictCondition calculates a system state based on the
previously generated Random
Forest model and the current values. The Discrete Values check box
switches from a continuous view to a categorical view in the inspect panel. Note that the check box is
only enabled when a statistical model is used for the KPI calculation.See
chapter „Discrete Values” for an
example.
The Discrete Values check box is
only available when a KPI
Instance is based on the built-in ssc_predictCondition function and the
KPI instance is selected in the inspect
panel. The ssc_predictCondition calculates a system state based on the
previously generated Random
Forest model and the current values. The Discrete Values check box
switches from a continuous view to a categorical view in the inspect panel. Note that the check box is
only enabled when a statistical model is used for the KPI calculation.See
chapter „Discrete Values” for an
example.
KPI Instance View
In the KPI instance view you can monitor your KPIs as well as recalculate them.
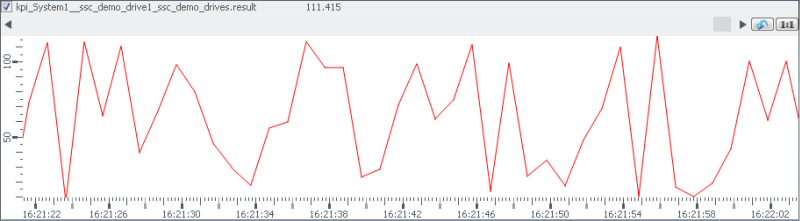
KPI Instance Trend View
The trend view shows the KPI selected from the KPI view, on the time axis. The functions such as "Go to now", "Go to ruler" etc. of the trend are available via a right-click on the trend area.