Classification Wizard - Training
In the "Training" panel you can:
-
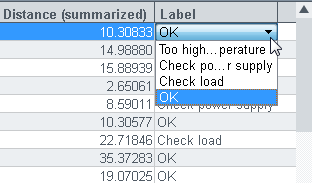
change the labels for values
-
monitor the differences between the values and identify spikes in the data point values
-
view the value difference of a data point value to the average value of a cluster
-
apply the data to a random forest model and create a random forest model.
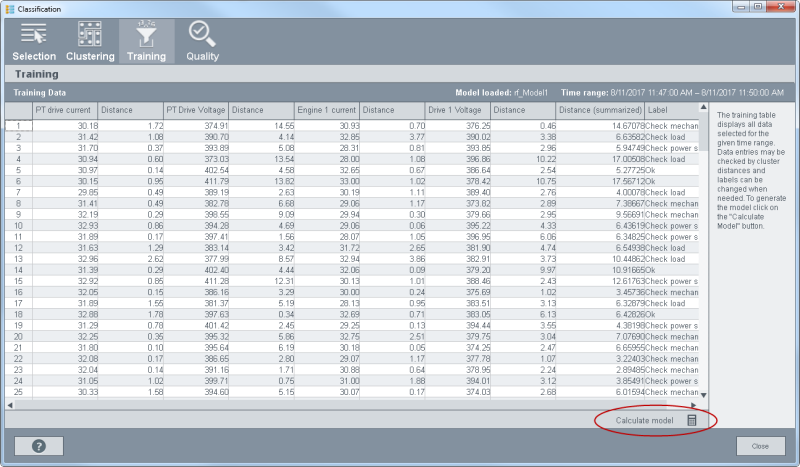
The Training panel represents all values of the selected time range. The time range was selected in the Selection panel. The column "Distance" displays the distance between this specific value and the cluster average value. This specific value is an absolute value. The cluster average value is visible in the "Clustering" panel.
You can change a label for a data point value by using the combo box in the Label column:
The "Calculate model" button saves the Training data as random forest model. The system uses a part of the labeled data to learn the model. Note that in order to check the quality of the model in the Quality panel, the model must be saved by using the "Calculate model" button: