Classification Wizard - Clustering
In the "Clustering" panel you can:
-
Estimate the number of clusters
-
Suggest clusters
-
Calculate clusters
What is a cluster?
Suppose that:
-
there are two data points, for example, current and voltage,
-
there is a relationship between these data points.
-
you can balance the relationship since it is a numerical value.
-
you have, for example, four clusters: 1 Normal condition, 2 Too high temperature, 3 Disturbance of the power supply, 4 Too high temperature and disturbance of the power supply
There are average values for each cluster. These are average values for each of the data points used for the clustering. For temperature the average for the cluster 1 would be 25° and for the cluster 2 it would be 50°. A cluster is not the average value of a data point. A cluster is the average value of a data point in a given cluster. The clustering panel calculates clusters by using the values calculated and shown in the Selection panel.
The different parts of the Clustering panel as well as how to use the Clustering panel are described in more detail in the following.
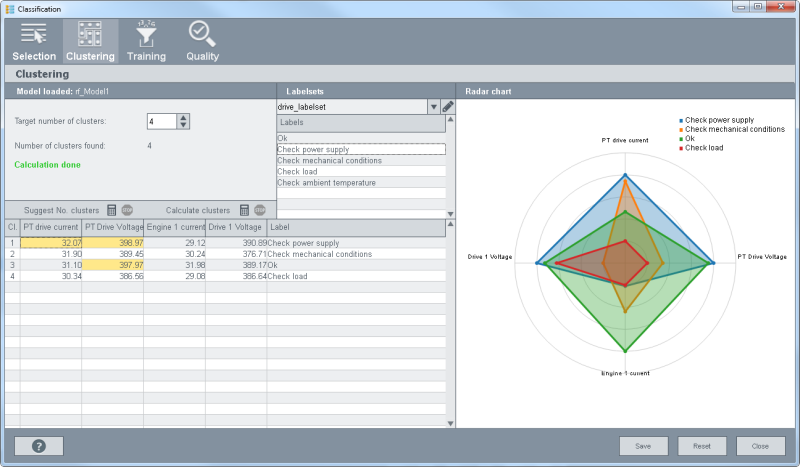
Clustering
Target number of clusters & Suggest No. clusters
With the "Target number of clusters" you can set the number of clusters manually via the spin buttons.
The "Calculate clusters" option calculates clusters according to the selected data points and according to the specified number in "Target number of clusters". The "Suggest No. clusters" option is automatically suggested by the computer.
Note that the number of clusters may not be 1. The minimum number of clusters is 2! Otherwise one cluster contains all data and the data cannot be compared.
Calculate clusters
The "Calculate clusters" option calculates clusters according to the selected data points and according to the specified number "Target number of clusters". Note that the "Calculate clusters" button deletes the specified labels since clusters are recalculated.
Figure: Calculated clusters
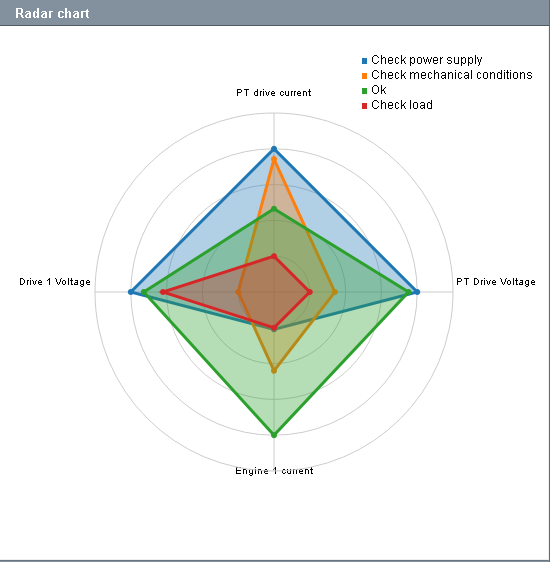
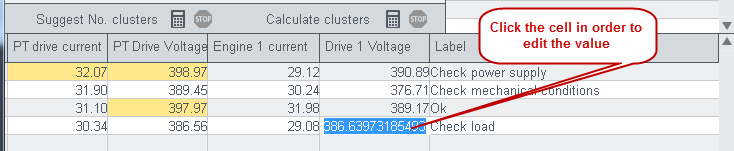
You can modify the cluster center (average values) of the clusters by dragging the point (value) within the graphics. You can use this function to modify the average value if needed. You can also change the value in the table - see figure at the end of this chapter.
Note that the chart (see above) uses absolute values. If you drag the point (value), negative values in the value table are overwritten.
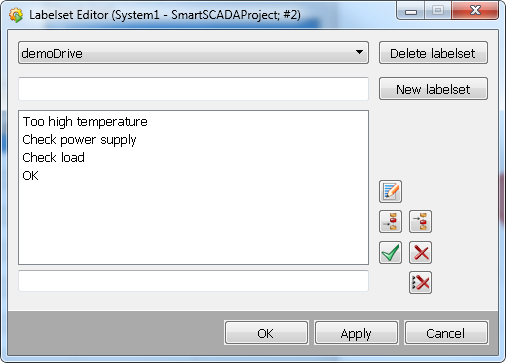
 The Edit labelset buttons opens the label editor
where you can create new labels for the clusters. The labels can then be added to
clusters - see the step "Labels" below.
The Edit labelset buttons opens the label editor
where you can create new labels for the clusters. The labels can then be added to
clusters - see the step "Labels" below.
Enter the name of the label you want to create into the text field or open the text
editor via the  button. Confirm with the
 button. You can also create new labelsets and
thereafter add labels to a labelset. If a labelset is no longer needed, delete it
using the "Delete labelset".
button. You can also create new labelsets and
thereafter add labels to a labelset. If a labelset is no longer needed, delete it
using the "Delete labelset".
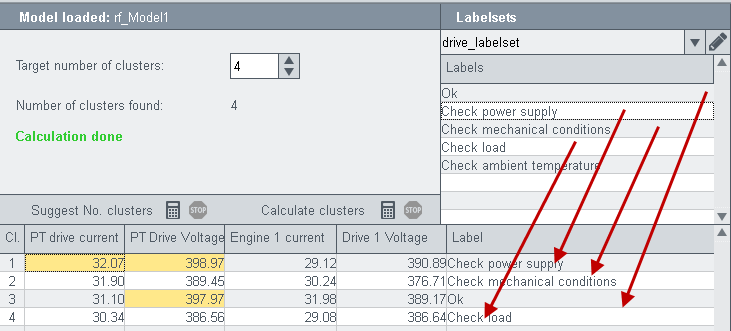
Labels
Add labels to the clusters via drag and drop. By using the labels you designate different states to clusters. In this way you specify which values are OK and which are not OK as well as what to do, for example, "Check power supply". In other words, Clusters specify which states are assigned to which data point values in a WinCC OA system. The cluster values can also be changed in the table (see the second figure below).