Classification Wizard - Selection
In the "Selection" panel you can:
-
Create new "Data visualization" sessions to visualize the data points of your system and select them for clustering. The session is used later to create a random forest model - see chapter Classification Wizard - Training.
-
Create new "Data visualization" sessions by loading an already existing data mining model and visualize your system. The configuration of the existing data mining model is used for the session and can be used for the clustering. The session is used later to create a random forest model - see chapter Classification Wizard - Training.
-
Visualize existing "Data visualization" sessions in order to view an older, for example, one specific configuration of your system and use this for the clustering and for the random forest model.
The different parts of the Selection panel as well as how to use the Selection panel are described in more detail in the following.
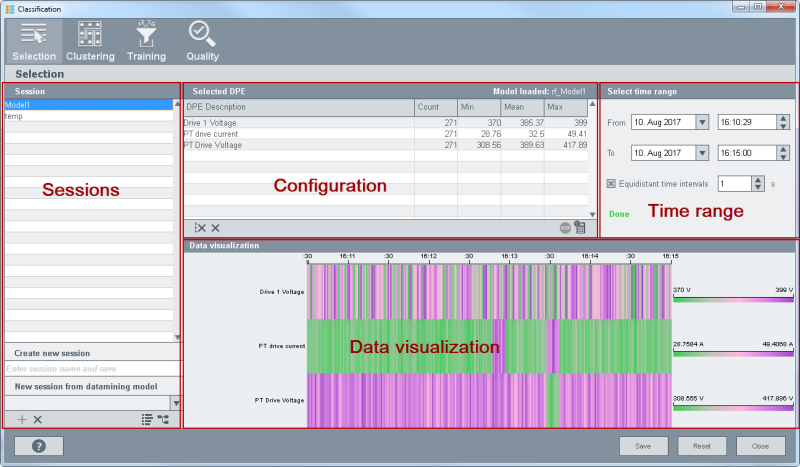
The "Selection" panel consists of the following parts: Sessions, Configuration, Time range and Data visualization.
Sessions
Create new session:
Click in the "Create new session" field and enter a name for your session. Click the "+" button to create a new session or you can also press Enter after typing a name in order to create a session. The session is used later to create a random forest model - see chapter Classification Wizard - Training.
New session from data mining model:
If you have created a data mining model via the data mining wizard, you can create a session by using the model. The configuration of the existing data mining model is used for the session and can be used for the clustering. The session is used later to create a random forest model - see chapter Classification Wizard - Training.
The temp session may not be deleted in the Selection panel.
Configuration
Selected DPE
Select the data point elements you want to visualize from your system. Note that you have to select data point elements. The table shows the count of the DPs, the minimum and maximum values as well as the mean.
Note that the "count" of the values must be same for all values in order to display the values for the next steps of the wizard.
 Deletes all DPEs from the table.
 Deletes the selected DPE from the table.
 The button with the
calculator symbol calculates the data for the Data
visualization. When the calculation is ready, the text "Done" is shown in
the "Select time range" area. The stop button stops the calculation.
The button with the
calculator symbol calculates the data for the Data
visualization. When the calculation is ready, the text "Done" is shown in
the "Select time range" area. The stop button stops the calculation.
Time range
Select Time range
Select the time frame "From - To" for the data points.
The "Equidistant time intervals" check box allows you to generate values every [specified] second. This is useful if the different data points under "Selected DPEs" do not contain the same amount of DPEs. In other words, the "count" is not same for the "Selected DPEs". By using the spin button you can generate values at intervals of the specified [time]. Depending on the specified time, values are, for example, generated every 2 seconds.
When the calculation is ready, the text "Done" is shown in the "Select time range" area.
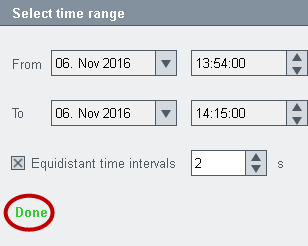
The "Equidistant time intervals" can only be set to a meaningful number of seconds meaning at least 1 second.
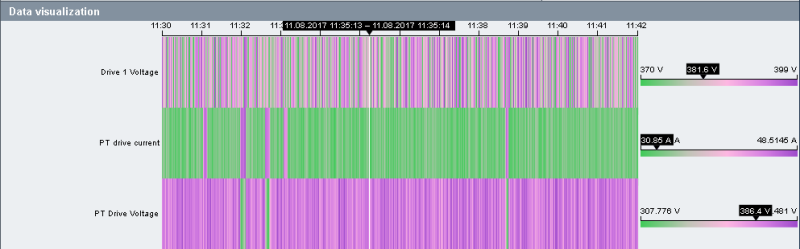
Data visualization
The data visualization shows the selected data points on a time line. You can display a value at a specific time by moving the mouse along the time line. The value at a specific time is shown above the time line and on the right on the smaller time line.

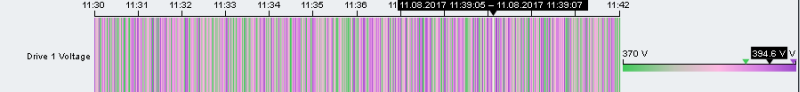
Special case: Data visualization and unequal number of values
If the data points that you selected for your session contain an unequal number of values and you do not check the check box "Equidistant time intervals", consider the following:
The values are displayed starting from the left side. When the number of values for the different data points selected for the session is unequal. In other words the amount of values is different for the selected data points, black spaces are shown in the data visualization. See figure below:

Buttons
The button "Save", "Reset" and "Close" are available in all panels of the Classification wizard.
Save
Saves the current settings of a panel.
Reset
Resets a value to the current original value or resets a setting to the current original setting. In order to reset a value to the original value, answer the question "Do you want to save the changes" with "No".
Close
Closes the wizard.


