Working with WinCC OA Excel Report
In this section, you can see how the different tasks slot into each other and how the program functions can be integrated (synergistically). This example illustrates:
-
A typical procedure for creating a report, from data generation through to Excel Report.
-
how you construct a worksheet in WinCC OA Excel Report and link its cells with the data points in the archive,
-
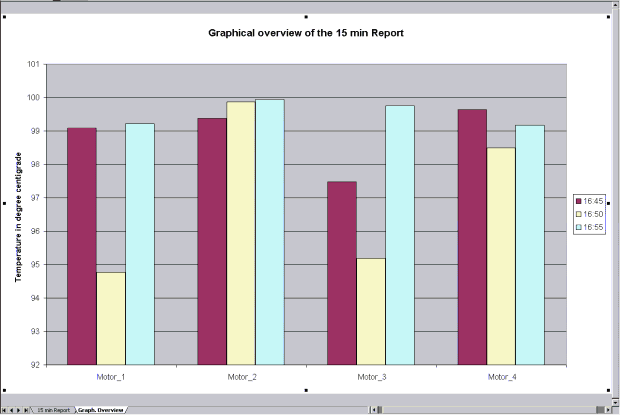
how you can create a report containing a chart in WinCC OA Excel Report.
We recommend the following configuration for this example:
MS Excel 2000/03/07 or XP
WinCC OA version 3.0 or higher
WinCC OA Excel Report
ADO 2.6
Client and host on the same PC
 Example
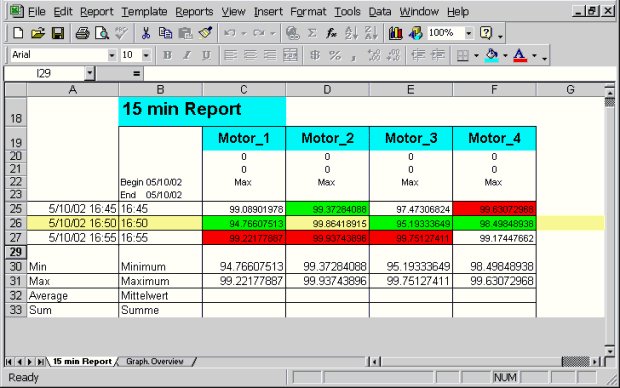
Generation of a 15-minute report (interval 5 minutes, period 15 minutes). Retrieval of the temperature of the DPs Motor_1, Motor_2, Motor_3 and Motor_4 of the motor DPT that has been configured as an AC type. The "temperature" data point element of Motor_1, Motor_2, Motor_3 and Motor_4 has two compression levels C1 and C2, each configured with Minimum and Maximum as statistical functions. Other data points could also be used in this example with retrieval of the relevant archived values.
Procedure
-
Start WinCC OA Excel Report (see also Starting WinCC OA Excel Report).
-
Enter password (see also Configuring WinCC OA Excel Report).
-
Import archive structure and data point list to Report 3.x (see also Configuring Excel Report).
-
Define base value (5 minutes in this case) and report type (here 15-minute report with interval of 5 minutes and period of 15 minutes) (see also Configuring Excel Report).
-
Create a new template (for example, by selecting the standard report).
-
Add data points (Motor_1, Motor_2, Motor_3 and Motor_4 here) (see also Adding a data point).
-
Save template under
<proj_path/data/xls_report/Template>with the extension ".xlt" (see also Opening and saving a template). -
Generate a new report by selecting the template created earlier and entering the time range (see also Creating a report).
-
Save the report under <proj_path/data/xls_report/Report> with the extension ".xls so that this can be opened whenever required.
-
After generating the report, you can also create a chart with values selected from the retrieved values with the aid of the Chart Wizard under MS Excel (see also Report design - charts).


