"setSeriesMarkerType"
Defines the type of a marker for a series.
Synopsis
void shape.setSeriesMarkerType(int series, int|string type [, string fileName])
Parameters
| Parameter | Description |
|---|---|
| series | number of the series |
| type | type of the marker |
| fileName | name of the file, when type == "Custom" |
Description
Defines the type for a marker. The types are the same number as in the trend widget. When using 9 (custom icon)
one can pass the icon fileName as a relative path to the pictures dir.
In additon to the numbers 0..9, one can also use the following strings for the type:
-
None
-
Rectangle
-
Cross
-
Plus
-
Star
-
Circle
-
Triangle
-
FilledCircle
-
FilledTriangle
-
Custom
In the Bubble chartType, when using the markerType "None" (default), "Circle", "Rectangle" or "FilledCircle", the separate bubbles will have their size calculated according to the given "value" array in setSeriesXYV(), where the minimum size (in Pixels) of one bubble is defined by the property bubbleMinSize and the maximum size by the property bubbleMaxSize. To have all bubbles use the same size, simply set both bubbleMinSize and bubbleMaxSize to the same value.
![]() Example
Example
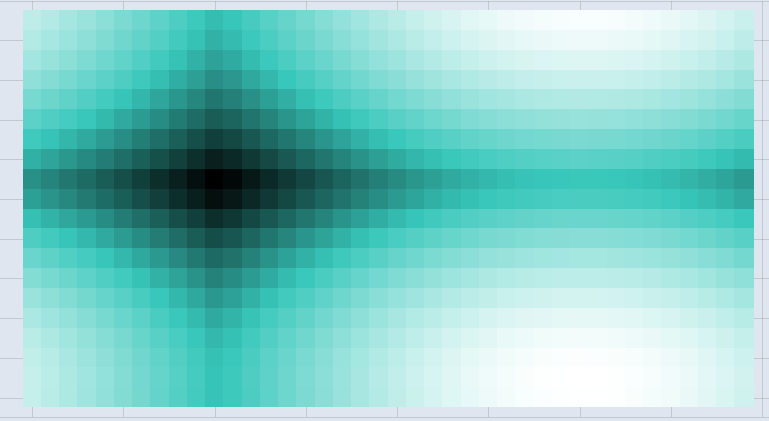
For example using the markerType "Rectangle" and setting a fixed bubble size, one can easily create a Heat-Map chart type when also the property bubbleColorFromValue is set to true. This ensures that the highest values given use a white color and the lowest values use the color given for this series (The colors are calculated using the HSL color model where the L (lightness) is changed according to the items value). In this use case it makes sense to define the series lineType to not show a border line around each rectangular „bubble“ by using setSeriesLineType.
main()
{
  dyn_float dx, dy, dv;
  const int maxX = 40;
  const int maxY = 20;
  float variationX = 180.0 * rand() / 32768.0;
  float variationY = 180.0 * rand() / 32768.0;
  for (int x = 0; x < maxX; x++)
  {
    for (int y = 0; y < maxY; y++)
    {
      dx[x * maxY + y + 1] = x;
      dy[x * maxY + y + 1] = y;
      dv[x * maxY + y + 1] = fabs(sin(deg2rad(variationX + x * (180.0 / maxX)))) +
      fabs(sin(deg2rad(variationY + y * (180.0 / maxY))));
    }
  }
  Chart_ewo1.chartType = "Bubbles"
  Chart_ewo1.bubbleColorFromValue = TRUE;
  Chart_ewo1.bubbleMinSize = maxY;
  Chart_ewo1.bubbleMaxSize = maxY;
  Chart_ewo1.setSeriesXYV(0, dx, dy, dv);
  Chart_ewo1.setSeriesMarkerType(0, "Rectangle");
  Chart_ewo1.setSeriesLineType(0, "[none,oneColor,JoinMiter,CapButt,0]");
  Chart_ewo1.setSeriesFillColor(0, "{32,113,106}");
}